May Market Update
May brought a noticeable increase in activity across the East Shore market, with both inventory and buyer engagement reaching their highest levels of the past year. New listings increased significantly as more sellers entered the market, while pending sales climbed to a twelve-month high. Total sales this week for condos and townhouses are up ↑245% from last year at this time, and single-family homes are up ↑31% year over year. Demand remained strong even as buyers were presented with more choices. The result was a healthier, more active market than we saw throughout much of the winter, with improving conditions for both buyers and sellers as we move into the summer season. Here are the stats:
Total Listing Count: 107 homes (↑ from 91 in Apr)

Total inventory increased significantly in May, rising from 91 to 107 listings. The jump was driven by a combination of new listings entering the market and a sharp increase in pending activity. After several months of relatively tight inventory, May marked a noticeable shift toward a more active spring market.
Months of Inventory: 3.4 months (↑ from 2.5 in Apr)
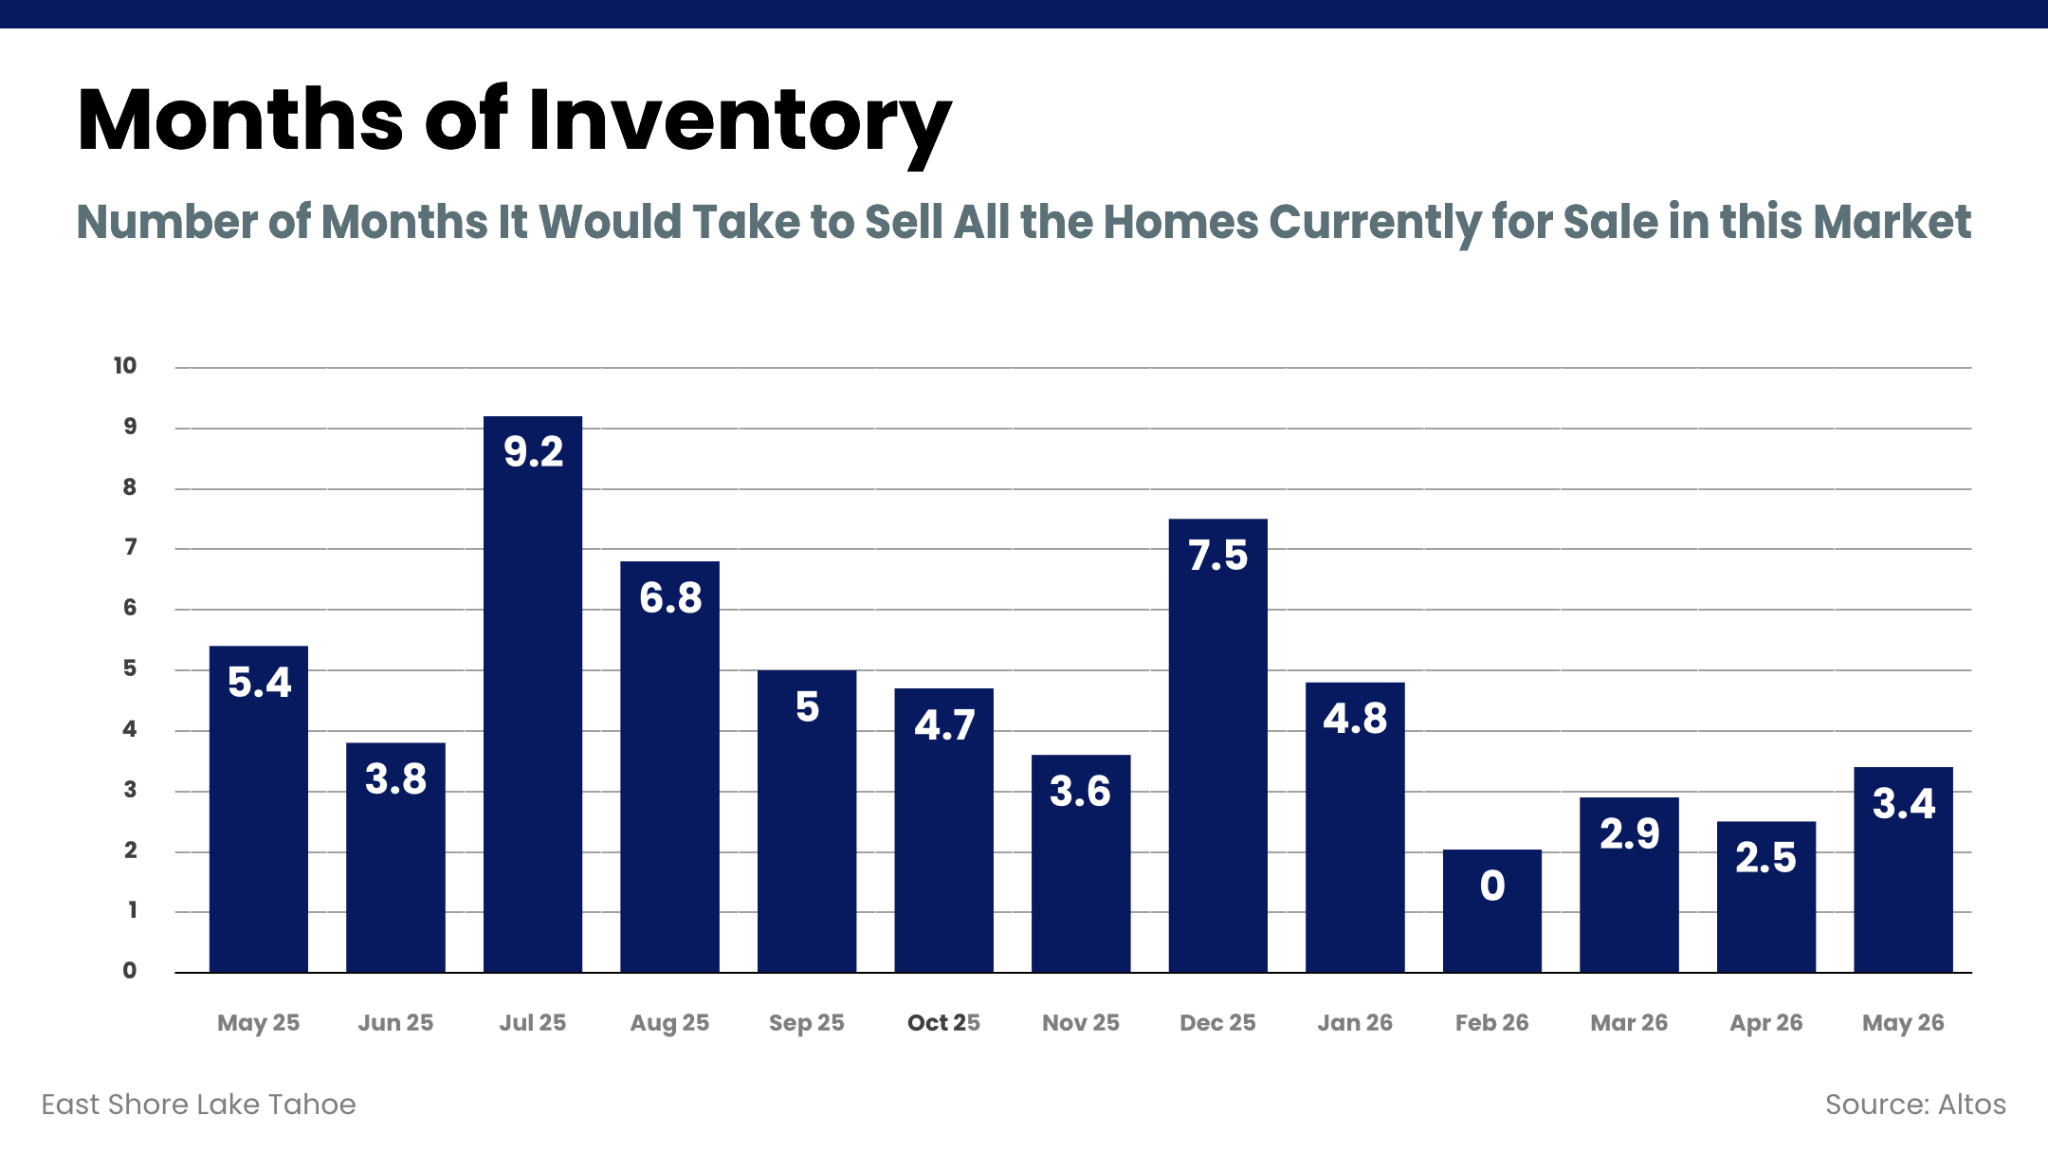
Months of inventory moved up to 3.4 months in May, the highest level since January. While still relatively low by historical standards, the increase reflects a market that is becoming a bit less competitive than it was earlier this spring. Buyers have gained some breathing room, though demand remains strong enough to keep overall inventory in check.
Number of Homes With Price Reductions: 13 homes (↑ from 12 in Apr)
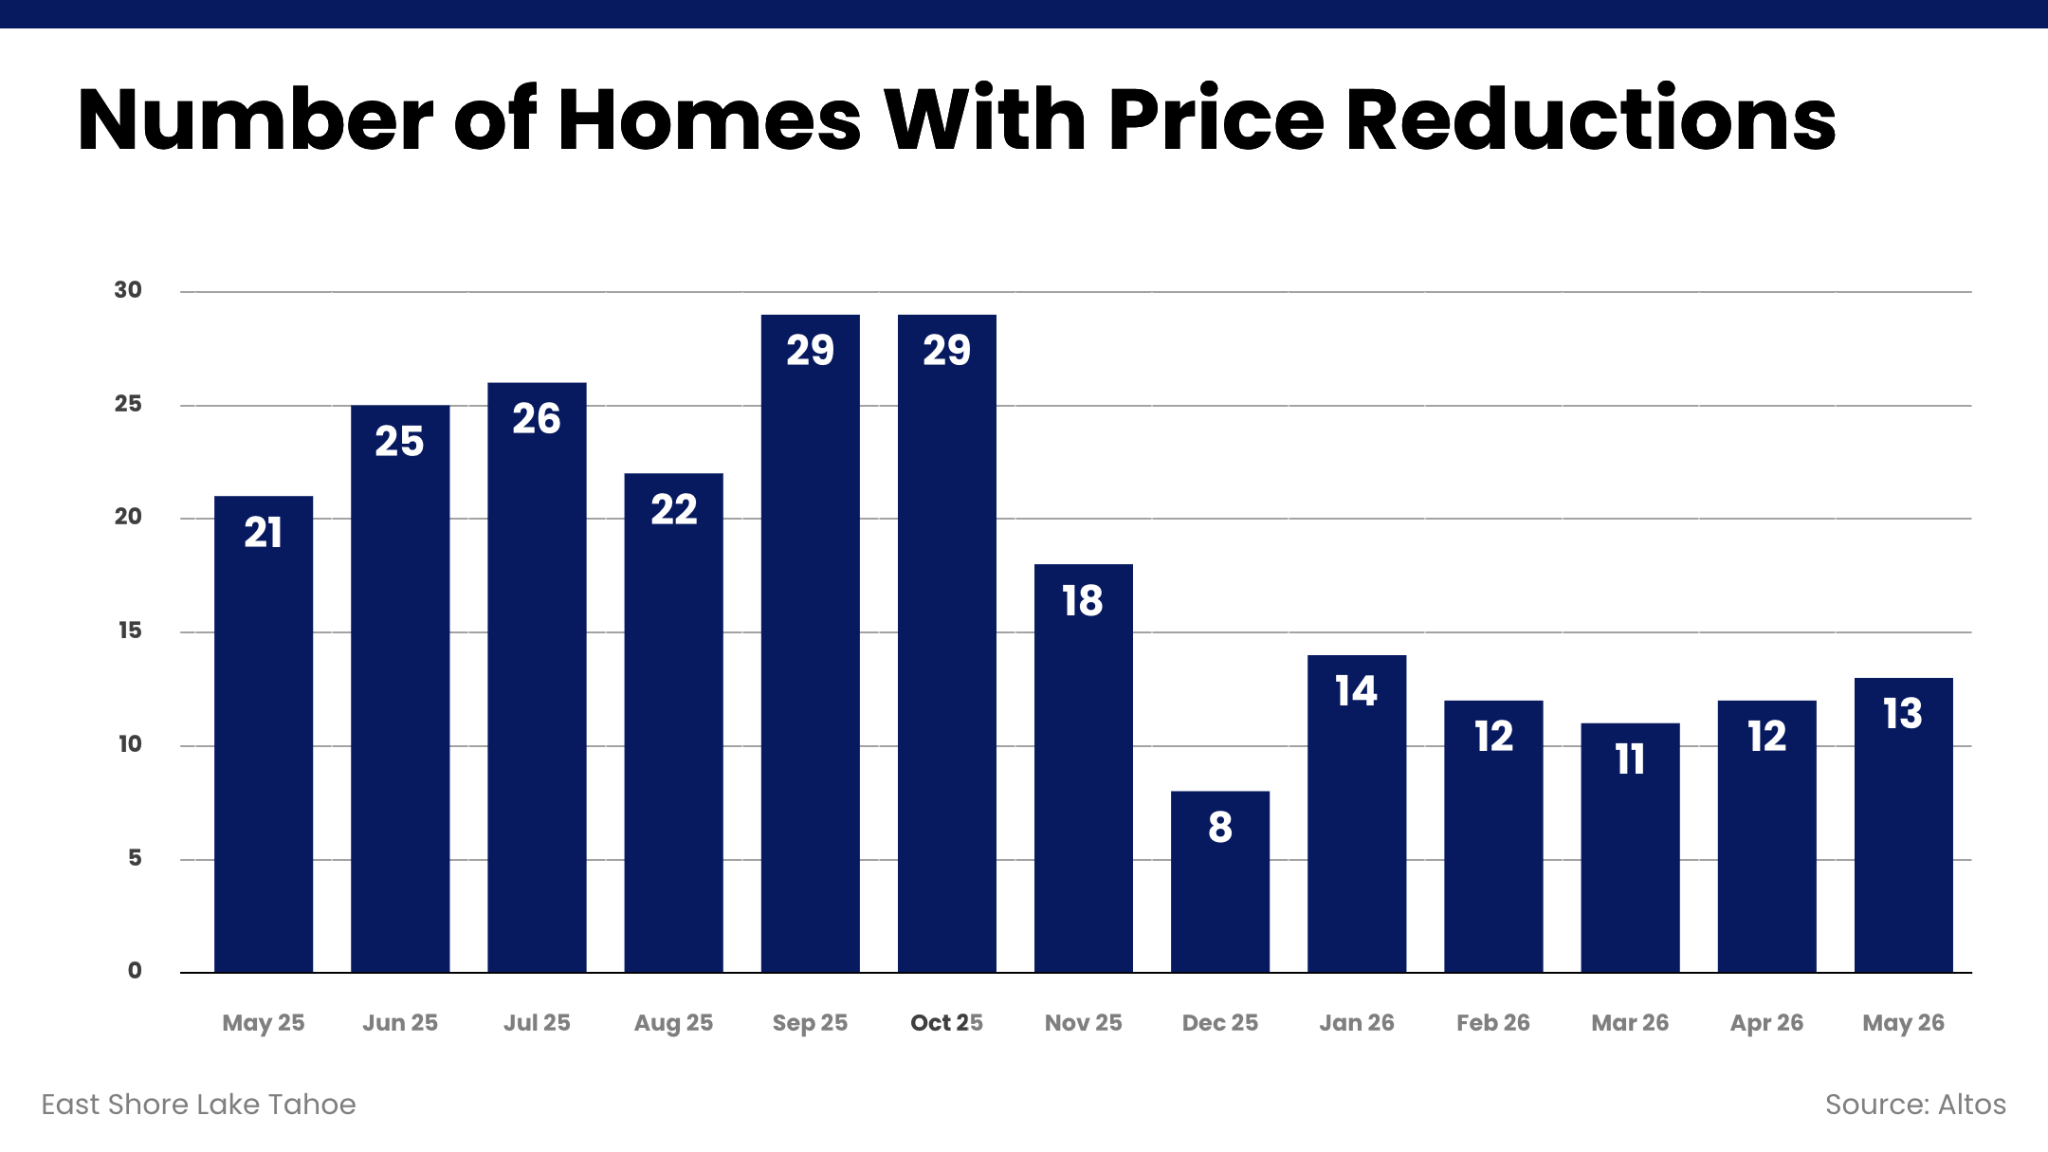
Price reductions were largely unchanged in May, rising from 12 to 13 homes. While a handful of sellers adjusted their asking prices, the overall number remains low relative to total inventory, suggesting most listings are entering the market at prices sellers are willing to hold.
Median Days on Market: 63 days (↓ from 112 in Apr)
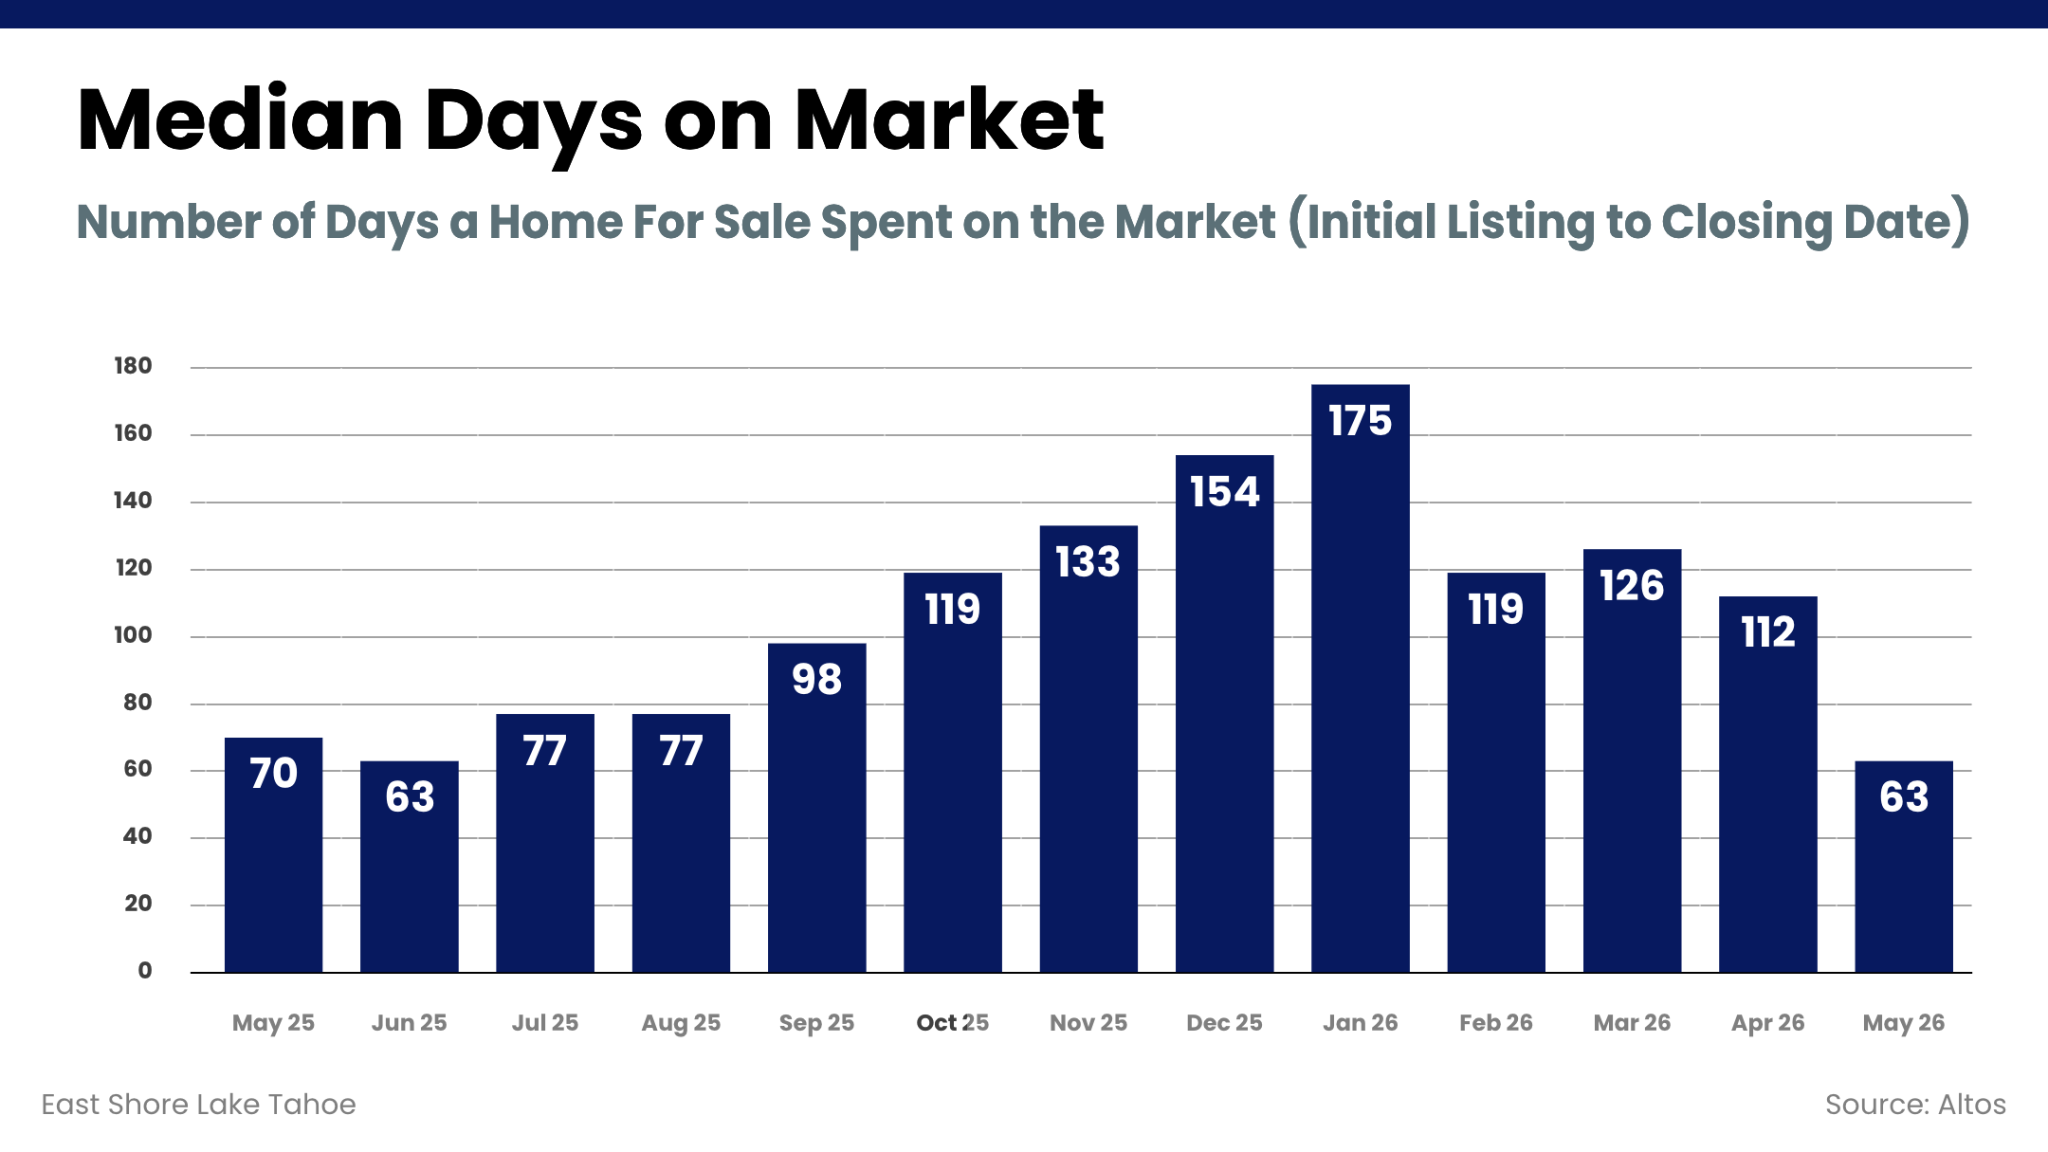
The slowdown that characterized much of the winter market eased considerably in May. Marketing times improved to their lowest level since last summer, reflecting increased buyer activity as the spring season gained momentum.
Median Listing Price per Square Foot: $928 (↓ from $997 in Apr)
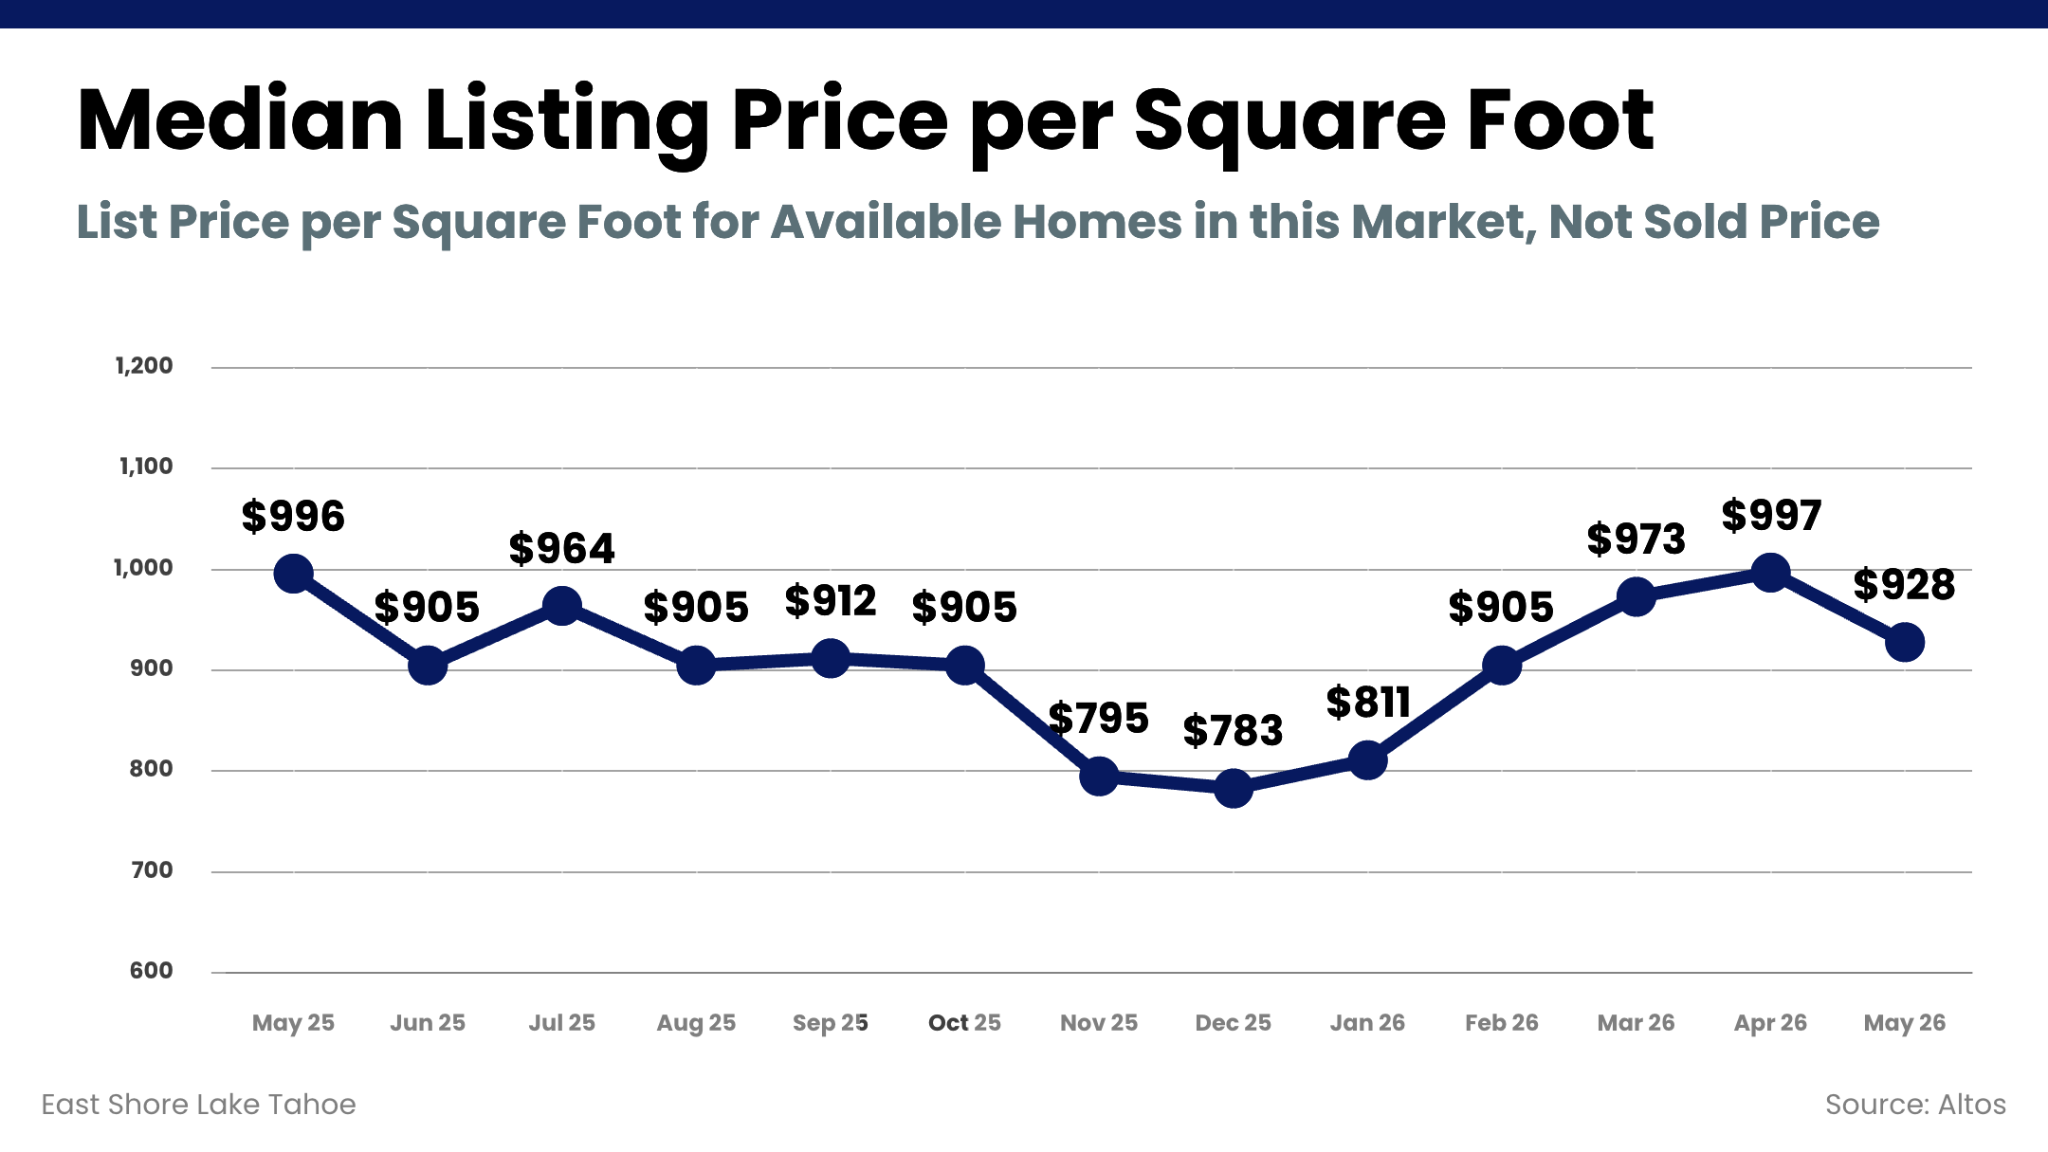
Price per square foot declined from April's elevated level but remains generally consistent with much of the past year. As always, this metric is heavily influenced by the mix of homes available for sale, and the decrease likely reflects more mid-range inventory entering the market rather than broad-based price softening.
Median Listing Price: $1,775,000 (↓ from $2,022,500 in Apr)
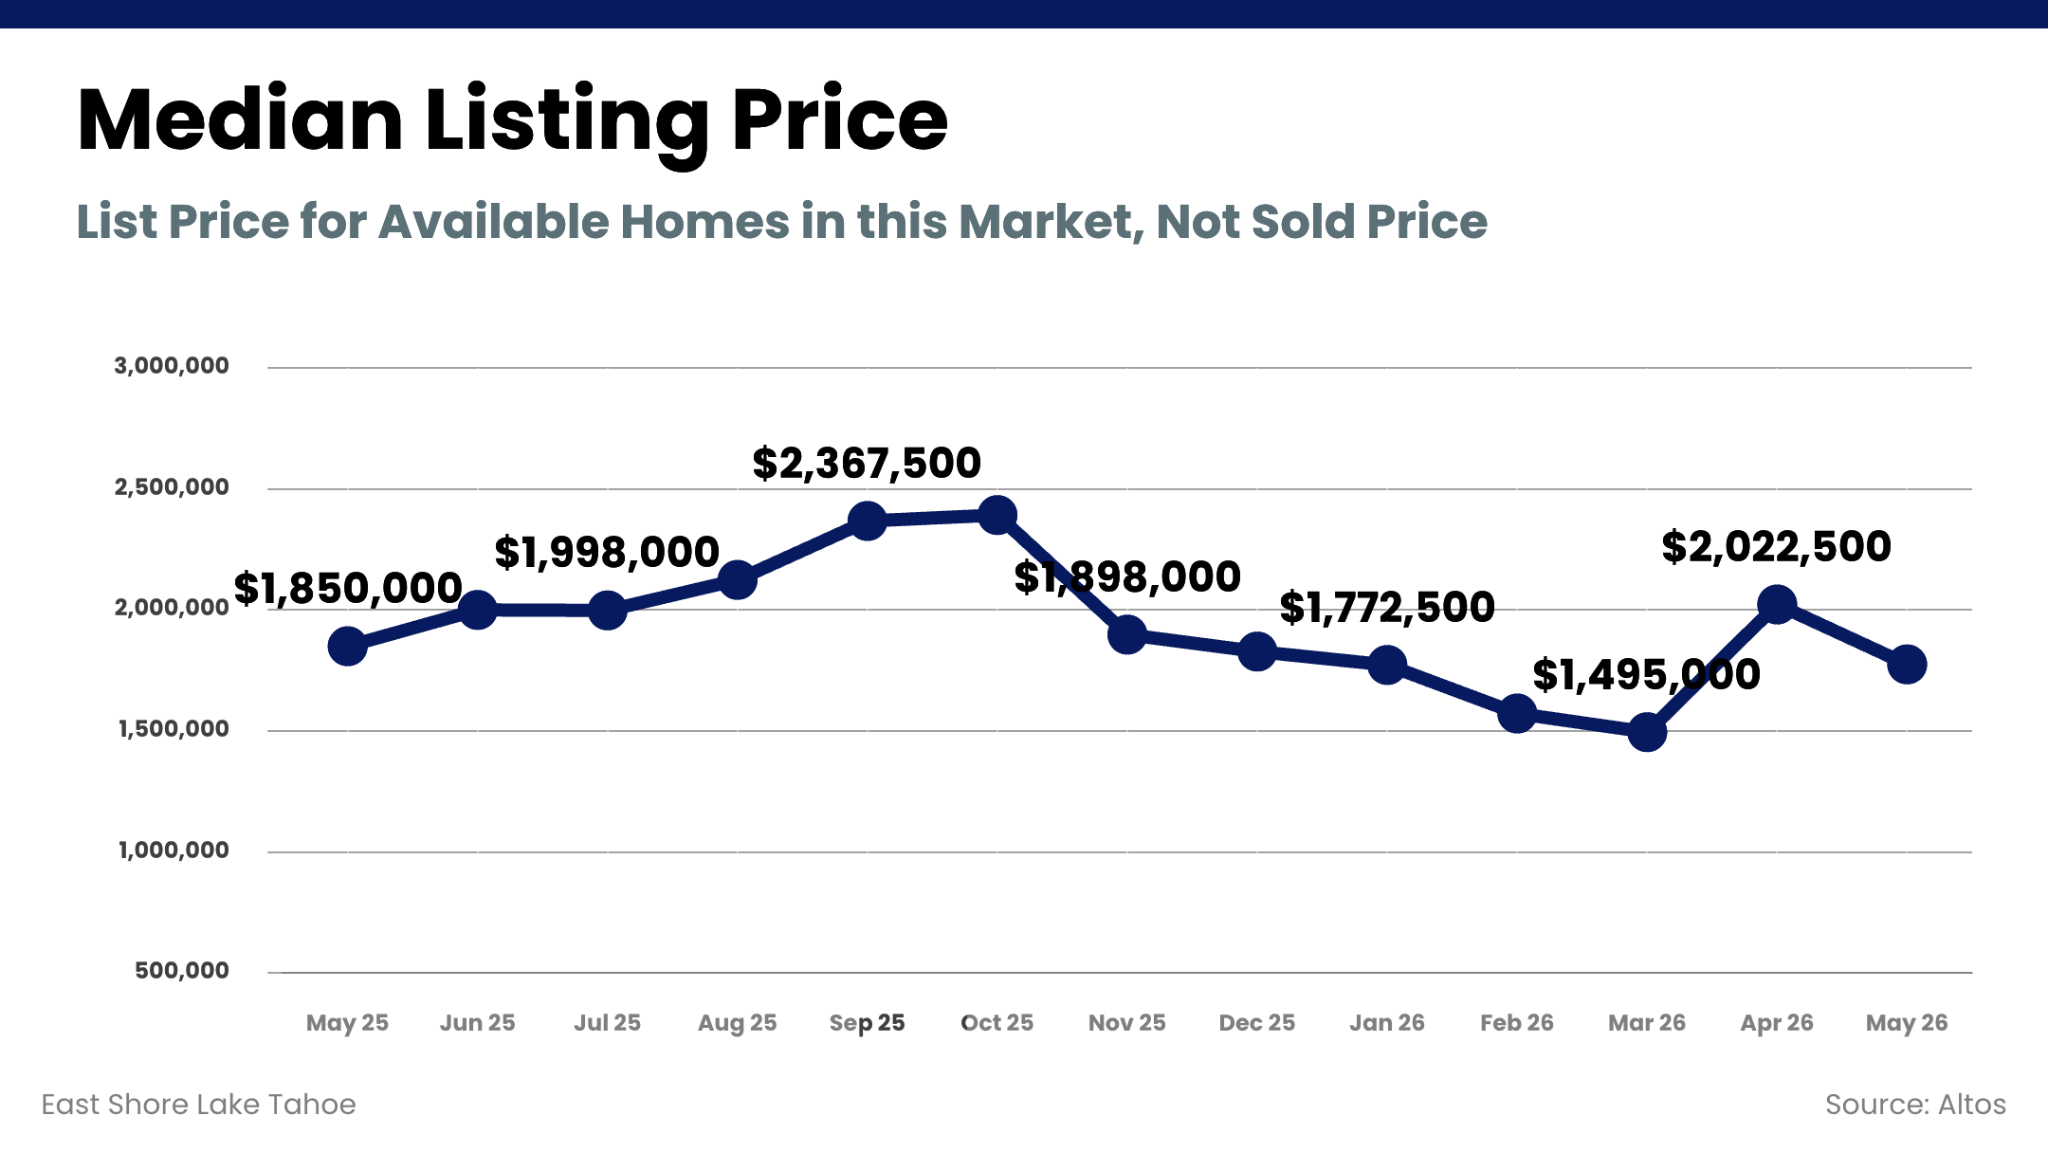
The median listing price moved lower in May after April's jump above $2 million. Like the median price per square foot, this shift is driven primarily by changes in the composition of available inventory rather than a widespread decline in asking prices. Even with the decrease, listing prices remain within the range seen throughout much of the past year.
Pending Listing Count: 47 homes (↑ from 30 in Apr)
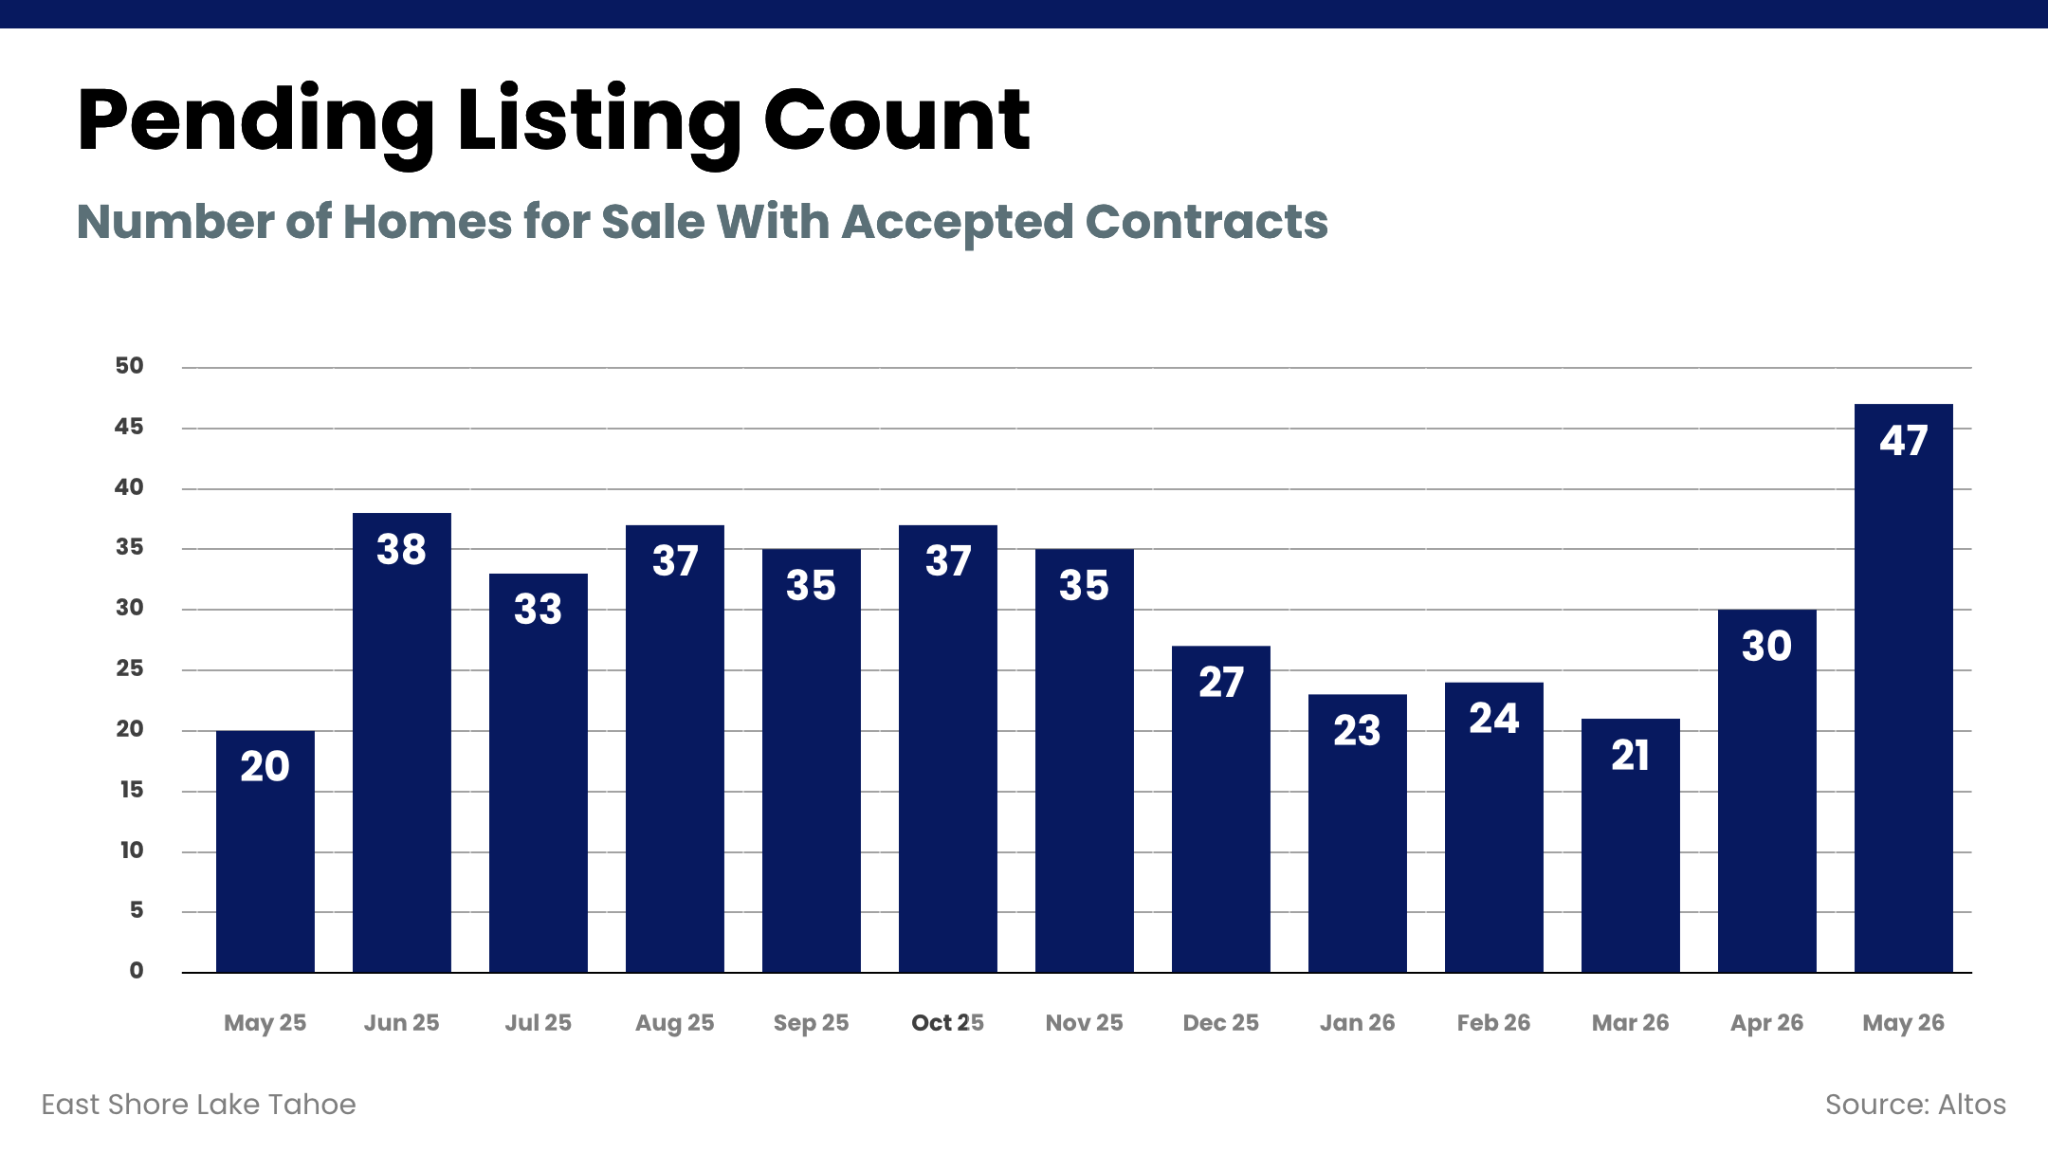
May marked the highest pending count of the past year, surpassing even the stronger months of last summer. This represents the strongest level of contract activity we've seen in the past 3 years.
New Listing Count: 36 homes (↑ from 23 in Apr)

New listings increased substantially in May, reaching their highest level of the past year. After a relatively constrained winter market, inventory is beginning to build more meaningfully as we move into early summer selling season. While new supply has increased, it has been met with strong contract activity, helping to keep overall market conditions balanced.
Active Listing Count: 83 homes (↑ from 74 in Apr)
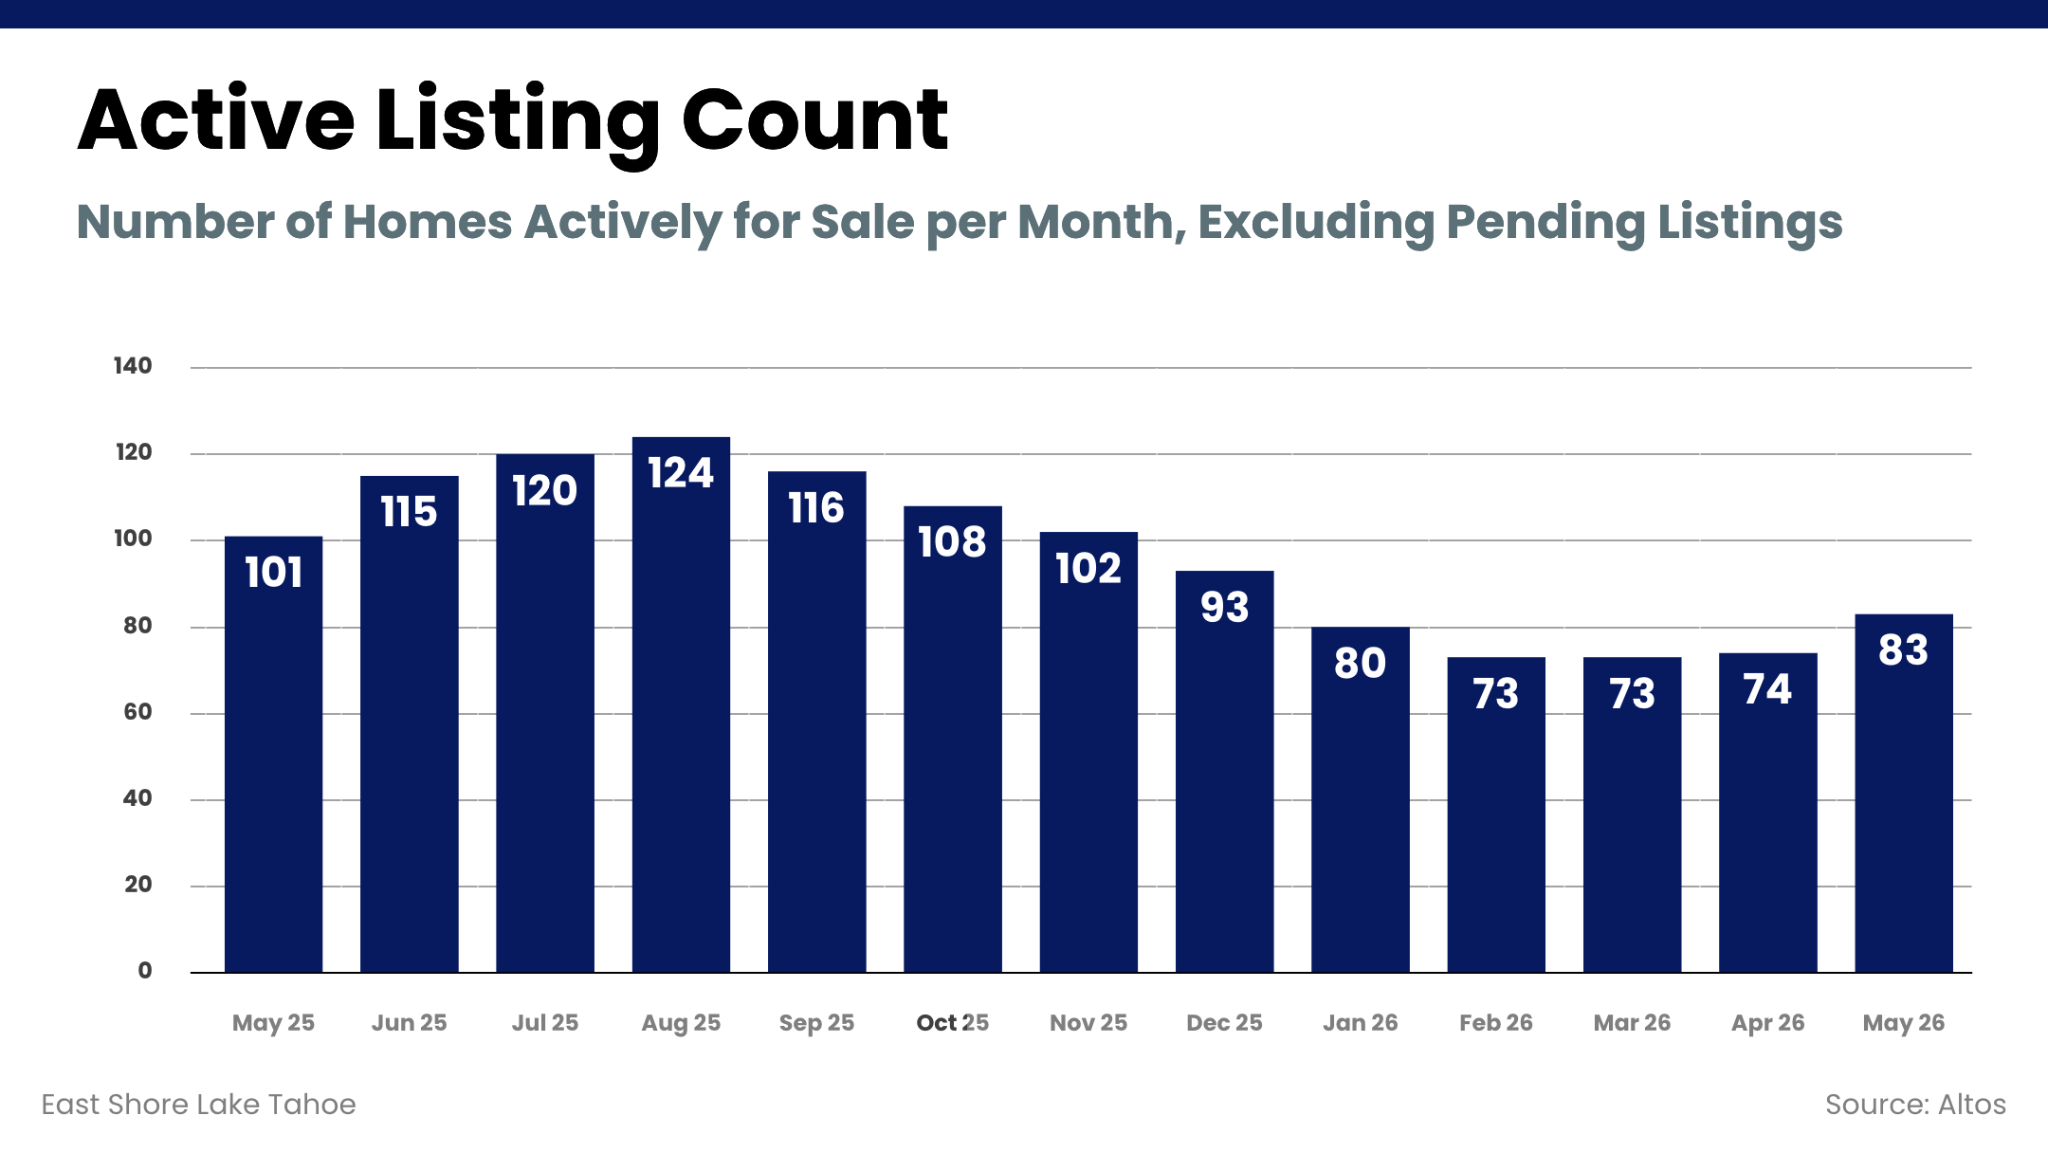
Active inventory increased from 74 to 83 homes, continuing the gradual expansion that began in April. While buyers now have more choices than they did earlier this year, inventory remains well below the levels seen during the summer of 2025, maintaining a relatively balanced market.
May's data reflects a market that continues to gain momentum heading into summer. Inventory expanded meaningfully, providing buyers with a broader selection of properties, while contract activity reached its highest level of the past year. Perhaps most encouraging is that increased inventory was met with increased demand, allowing the market to absorb new listings without a significant slowdown in activity. While buyers now have more options than they did earlier this year, overall supply remains relatively limited by historical standards. As we enter the busiest months of the year, the market appears well-positioned, with both buyer and seller participation contributing to a healthy and balanced environment.


4th of July in Lake Tahoe


Activities, Events, Live Music
Get In Touch