So far, August carried Tahoe deeper into a season of contrasts: warm, dry afternoons and smoky skies from regional fires, paired with crisp, cool nights that signaled the approach of fall. Lake surface readings remained elevated, with temperatures holding near 72 °F well into late August, continuing a streak of warmer-than-average waters. That persistence is a reminder of the lake’s heat retention, where even small heat waves or calm stretches can push temperatures into record territory. With daylight hours now shortening and cooler mornings becoming more common, the window for late-summer boating, swimming, and long days on the shore is closing fast.
As August winds down, the East Shore market reflects similar balance. Inventory remains elevated compared to last year, while buyer activity has held steady enough to keep pricing resilient. The pace is more measured than spring’s surge, but motivated buyers are still stepping up for well-positioned homes. With strong selection, steady demand, and firm values, the market is entering fall on even footing for both buyers and sellers.
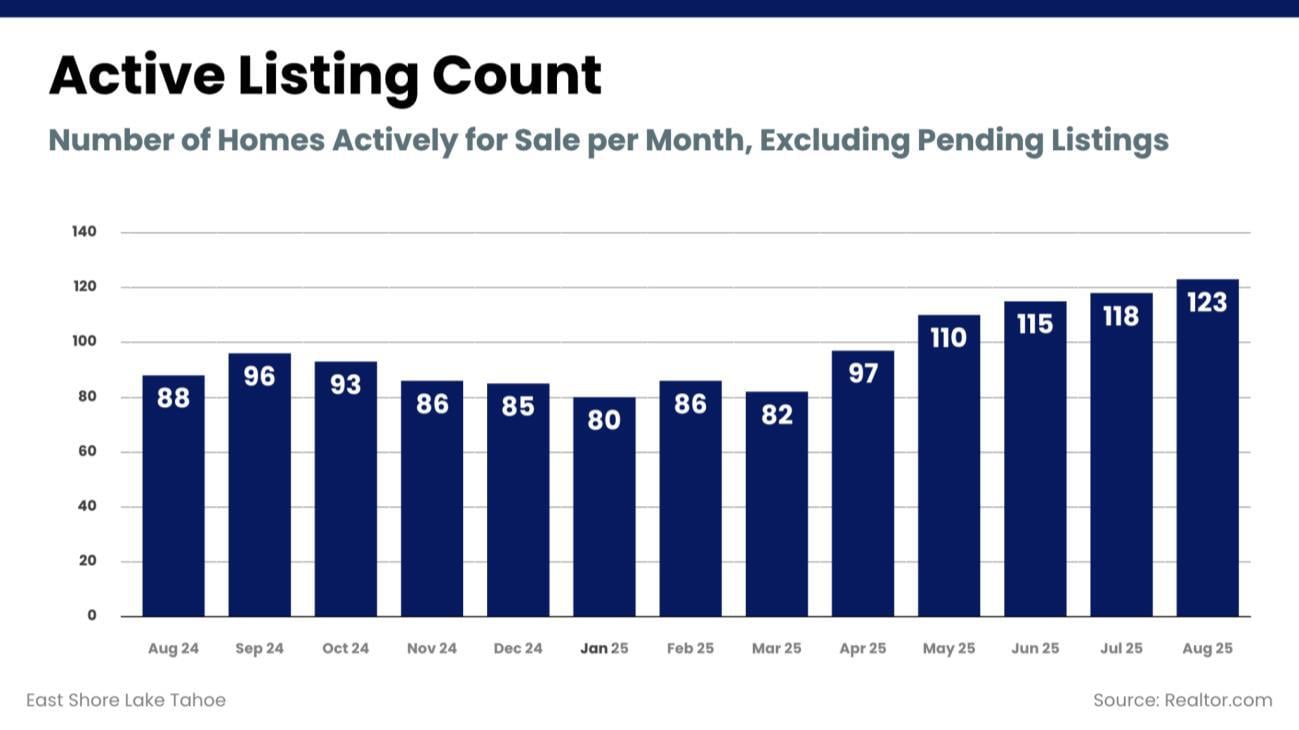
August: 123 homes (↑ from 118 in July, ↑ from 88 in August 2024)
Active listings increased to 123 in August, up from 118 in July and well above the 88 homes available at this time last year. Inventory has been building steadily for several months, bringing buyers the widest range of options seen in over a year. This growth marks a clear shift from the leaner winter and early spring markets, when supply was far more limited. Sellers are now facing greater competition, underscoring the importance of pricing and presentation to capture buyer interest.
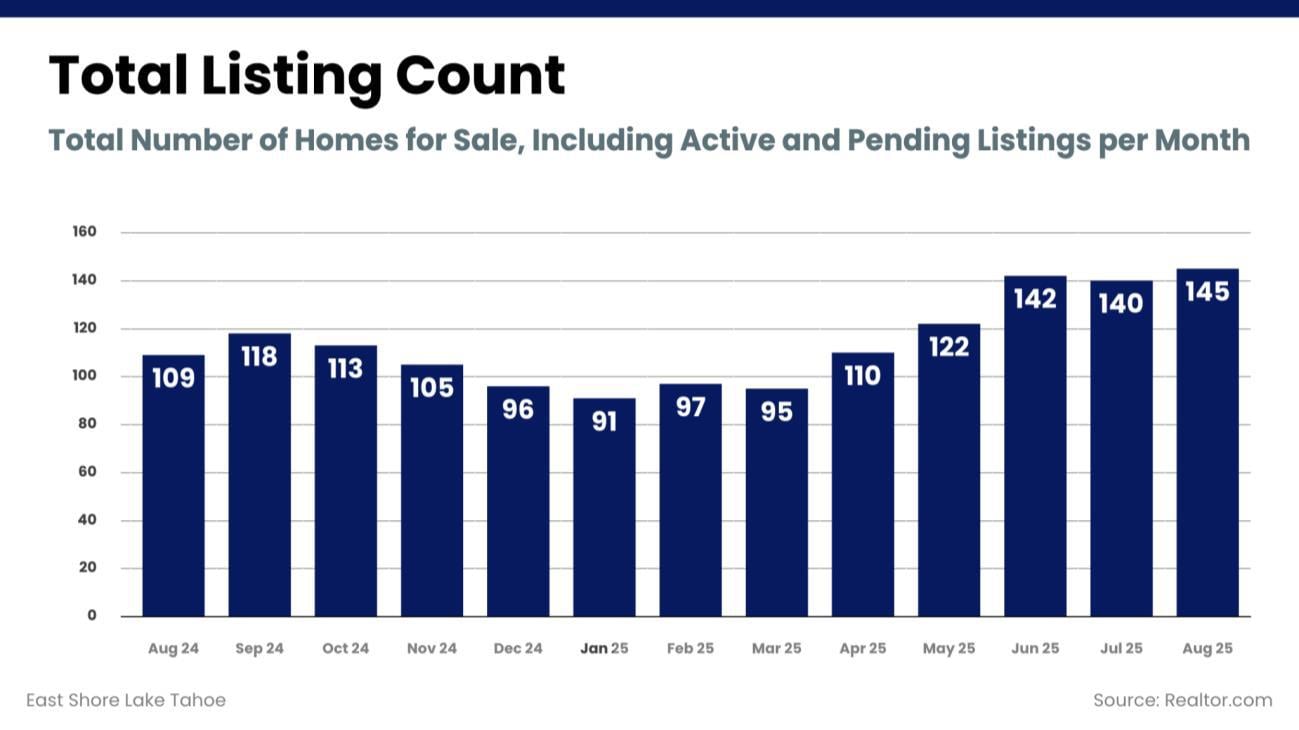
August: 145 homes (↑ from 140 in July, ↑ from 109 in August 2024)
Total listings, which include both active and pending, reached 145 in August. That’s slightly higher than July’s 140 and a major jump from 109 listings in August 2024. This marks the fifth consecutive month of rising supply, signaling a healthier flow of inventory compared to the shortage seen last winter. The increase gives buyers added negotiating power, but it also reflects a more balanced market overall, with activity spreading across a broader pool of available homes.
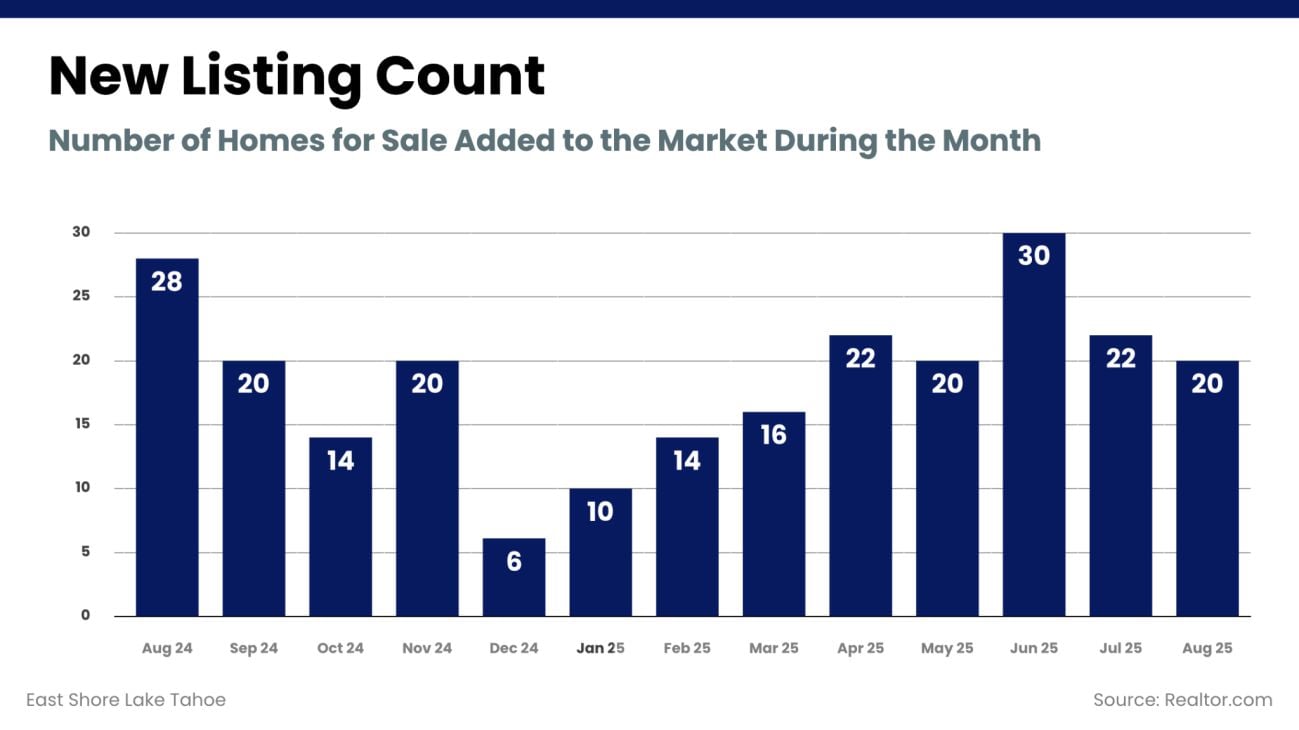
August: 20 homes (↓ from 22 in July, ↓ from 28 in August 2024)
New listings eased to 20 in August, compared to 22 in July and 28 during the same month last year. While overall inventory has grown, fewer fresh homes came online this month, slowing the pace of new additions. This trend could help prevent oversupply as we enter the quieter fall season, even with total listings at their highest levels in over a year. For sellers, this means competition remains elevated but not overwhelming, while buyers still have a strong selection to choose from without seeing a flood of new inventory.
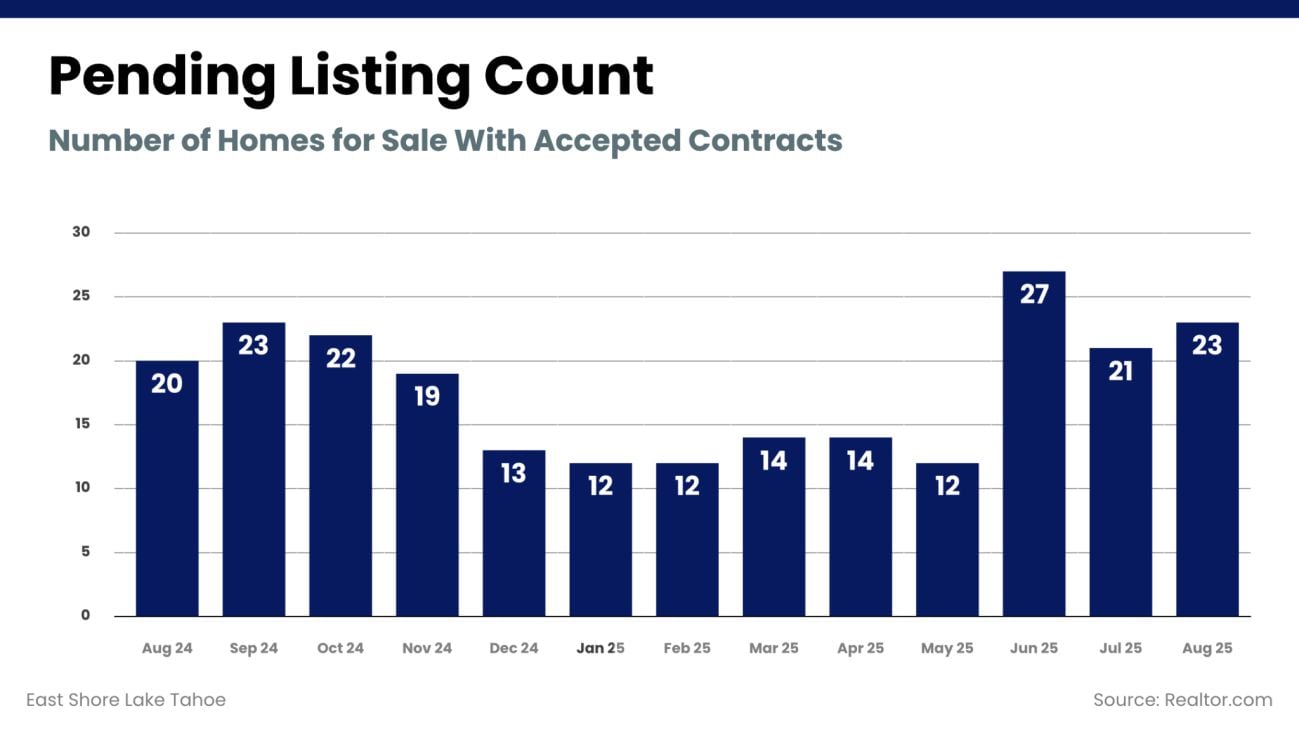
August: 23 homes (↑ from 21 in July, ↑ from 20 in August 2024)
Buyer activity showed a slight pickup in August, with 23 pending sales compared to 21 in July. This also represents a modest improvement from the 20 pending sales recorded in August 2024. Pending numbers remain far stronger than early 2025, when contracts dipped to just 12 per month, though they still trail June’s high of 27. The consistency in recent months suggests buyers are staying active despite higher inventory, supporting a more stable level of demand heading into fall.
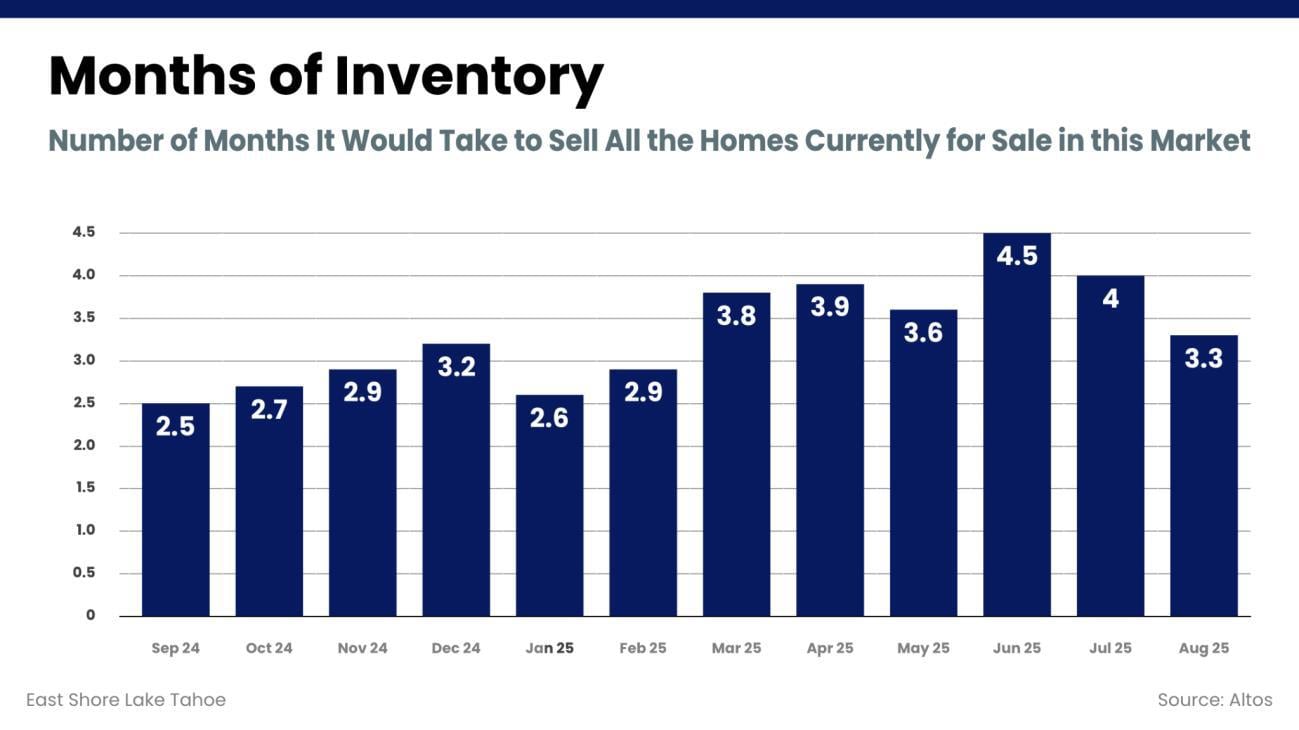
August: 3.3 months (↓ from 4.0 in July, ↑ from 2.5 in August 2024)
Months of inventory declined to 3.3 in August, down from 4.0 in July. This drop reflects stronger absorption of homes on the market, even as the overall number of listings continues to rise. By comparison, the East Shore was sitting at 2.5 months last August, so buyers today have a bit more breathing room. After peaking at 4.5 months in June, conditions have moved back toward balance, signaling a healthier relationship between supply and demand than earlier this summer.
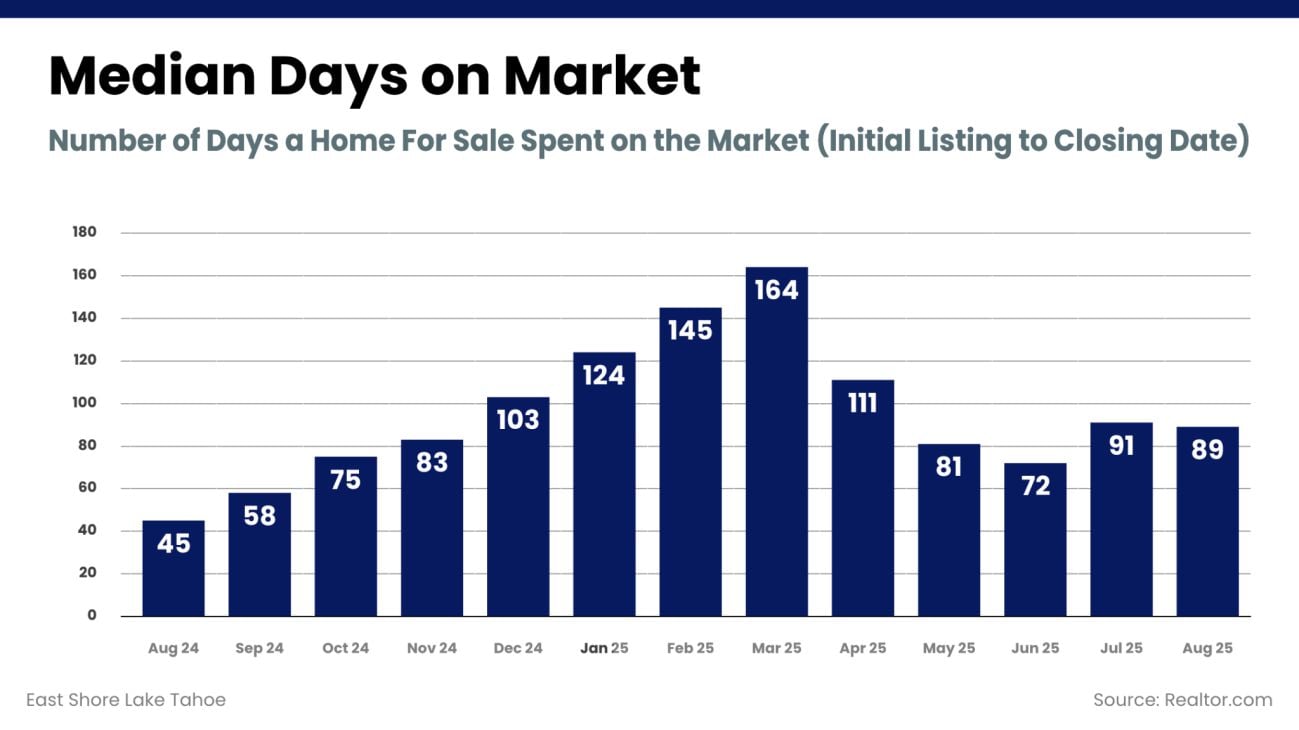
August: 89 days (↓ from 91 in July, ↑ from 45 in August 2024)
The median days on market ticked down slightly in August to 89, from 91 in July. While this marks a small month-over-month improvement, homes are still taking much longer to sell than they did last summer, when the median was just 45 days. The trend reflects a slower pace compared to the rapid turnover seen in 2024, even though timelines have improved significantly from the 164-day peak recorded in March. Sellers need to remain patient and realistic, as properties are generally taking three months or more to close.
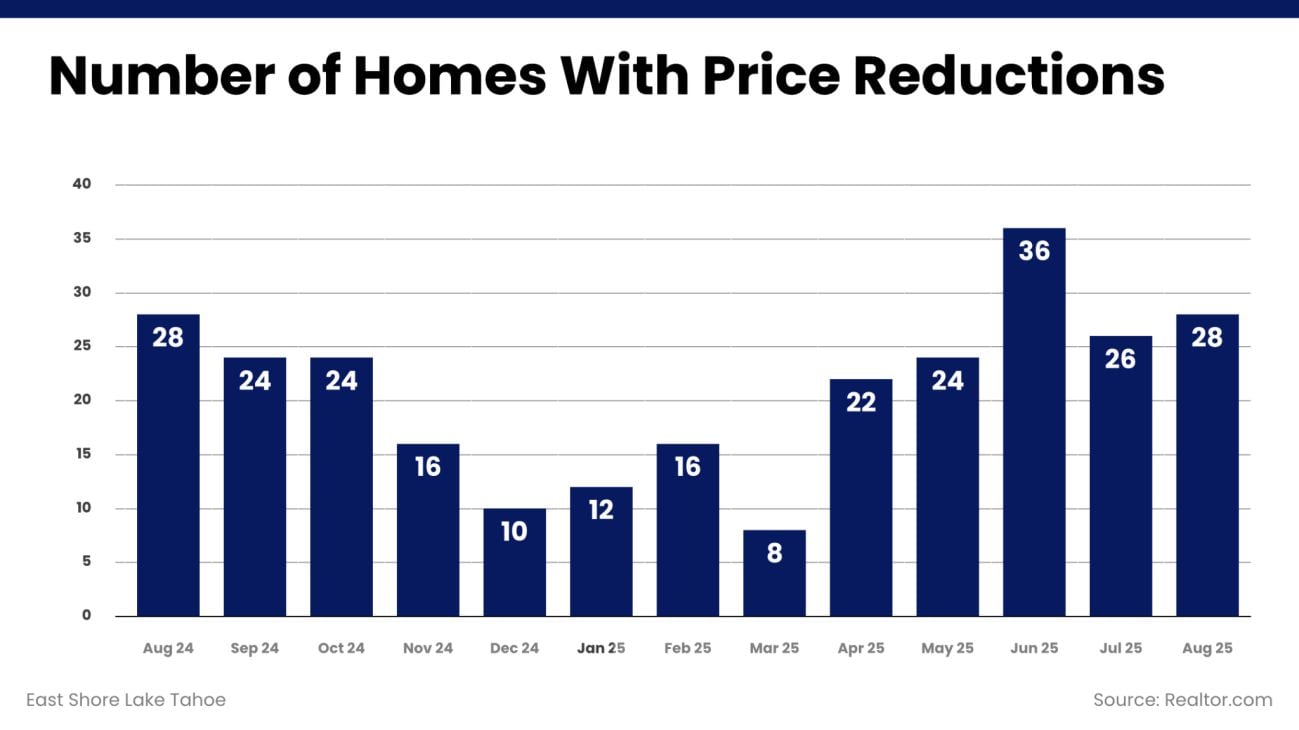
August: 28 homes (↑ from 26 in July, unchanged from 28 in August 2024)
The number of homes with price reductions rose slightly in August to 28, compared to 26 in July. This figure mirrors exactly where the market stood one year ago, when 28 reductions were also recorded. The consistency of this metric suggests that, despite higher overall supply, sellers are not adjusting prices at an accelerated pace. Instead, reductions remain in line with seasonal patterns, showing that while competition has increased, pricing discipline continues to play a central role in securing buyers.
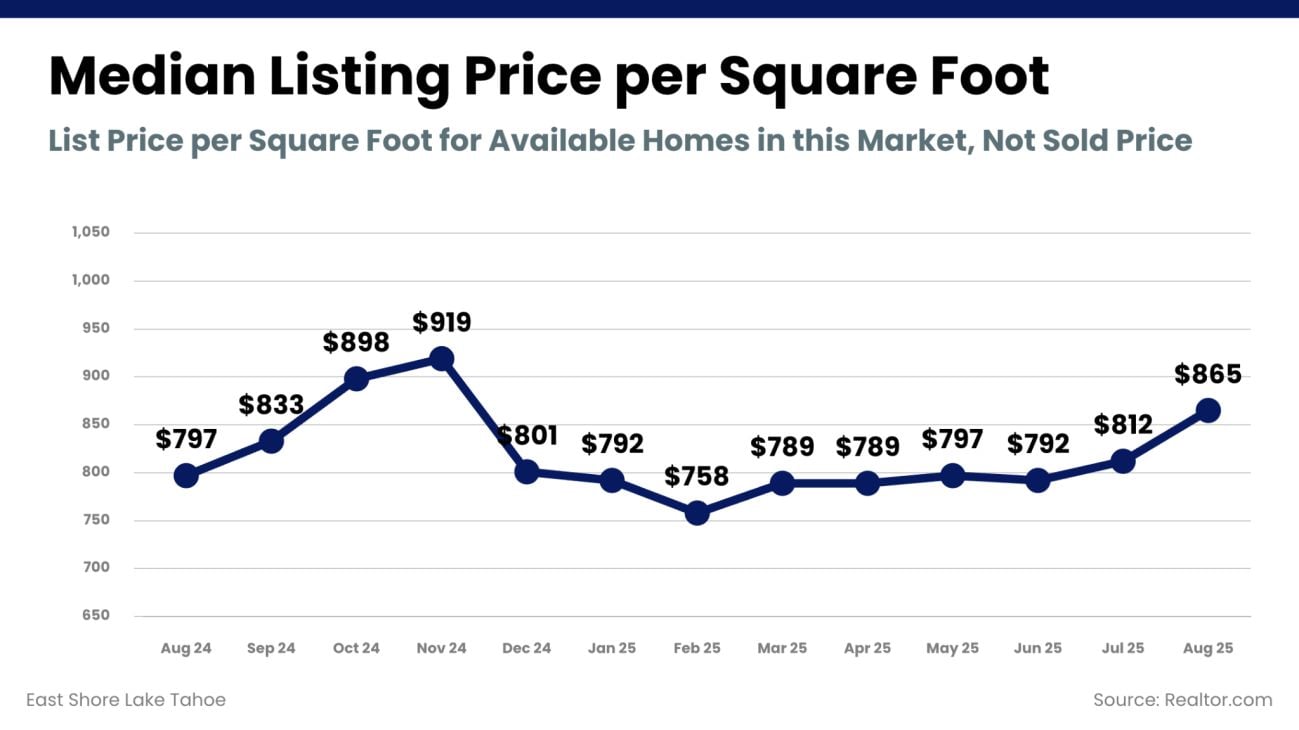
August: $865 (↑ from $812 in July, ↑ from $797 in August 2024)
List prices per square foot climbed to $865 in August, up from $812 in July and $797 last year. This is the highest level recorded since last fall, when values briefly topped $900. The consistent upward trend since spring shows that underlying property values are holding firm, even with more inventory available. For sellers, this demonstrates that well-priced homes are still achieving strong numbers, while buyers are paying premiums for quality locations and move-in ready properties.
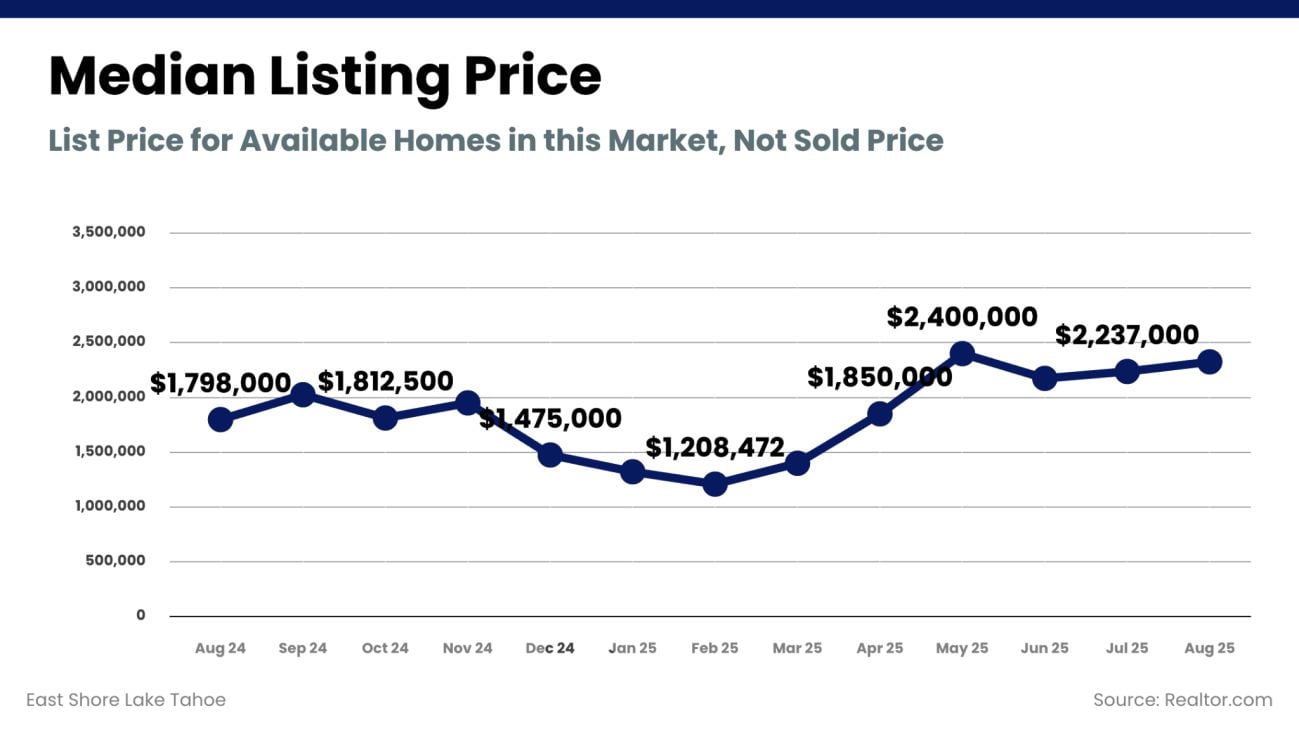
August: $2,237,000 (unchanged from July, ↑ from $1,798,000 in August 2024)
Median listing prices held steady in August at $2.24M, identical to July’s figure. Compared to last August’s $1.8M, the market is still showing considerable year-over-year appreciation. Prices remain below the May peak of $2.4M but have stabilized at a high level through the summer months. This stability underscores the resilience of the East Shore’s upper-tier market, where well-positioned homes continue to command strong valuations.
Big-Picture Takeaway
August closed with the East Shore market showing both higher supply and steady buyer engagement. Active and total listings are at their strongest levels in over a year, while pending sales have rebounded from early 2025 lows. Inventory and days on market have both improved since their winter and spring peaks, giving the market a more balanced feel. At the same time, pricing has held firm, with list values per square foot rising and the median price maintaining summer highs. Together, these factors highlight a market where buyers benefit from greater selection and negotiating room, while sellers who price competitively are still seeing successful results.