East Shore Market Update: A Stronger October for Pending Sales
October's East Shore real estate market looks quite different from this time last year. There are fewer homes for sale, asking prices have moved lower, and the supply of inventory relative to buyer demand has increased. While the usual seasonal slowdown is underway, the year-over-year comparisons reveal more about how market conditions have changed.
Total inventory is down approximately 14% from October 2025, yet months of inventory has increased from 4.7 to 5.7. This tells us that despite fewer available properties, the market is moving at a slower pace relative to supply. At the same time, median asking prices per square foot have declined more than 16%, while marketing times are unchanged from a year ago. These shifts are creating a different environment for buyers and sellers as we approach the end of 2026.
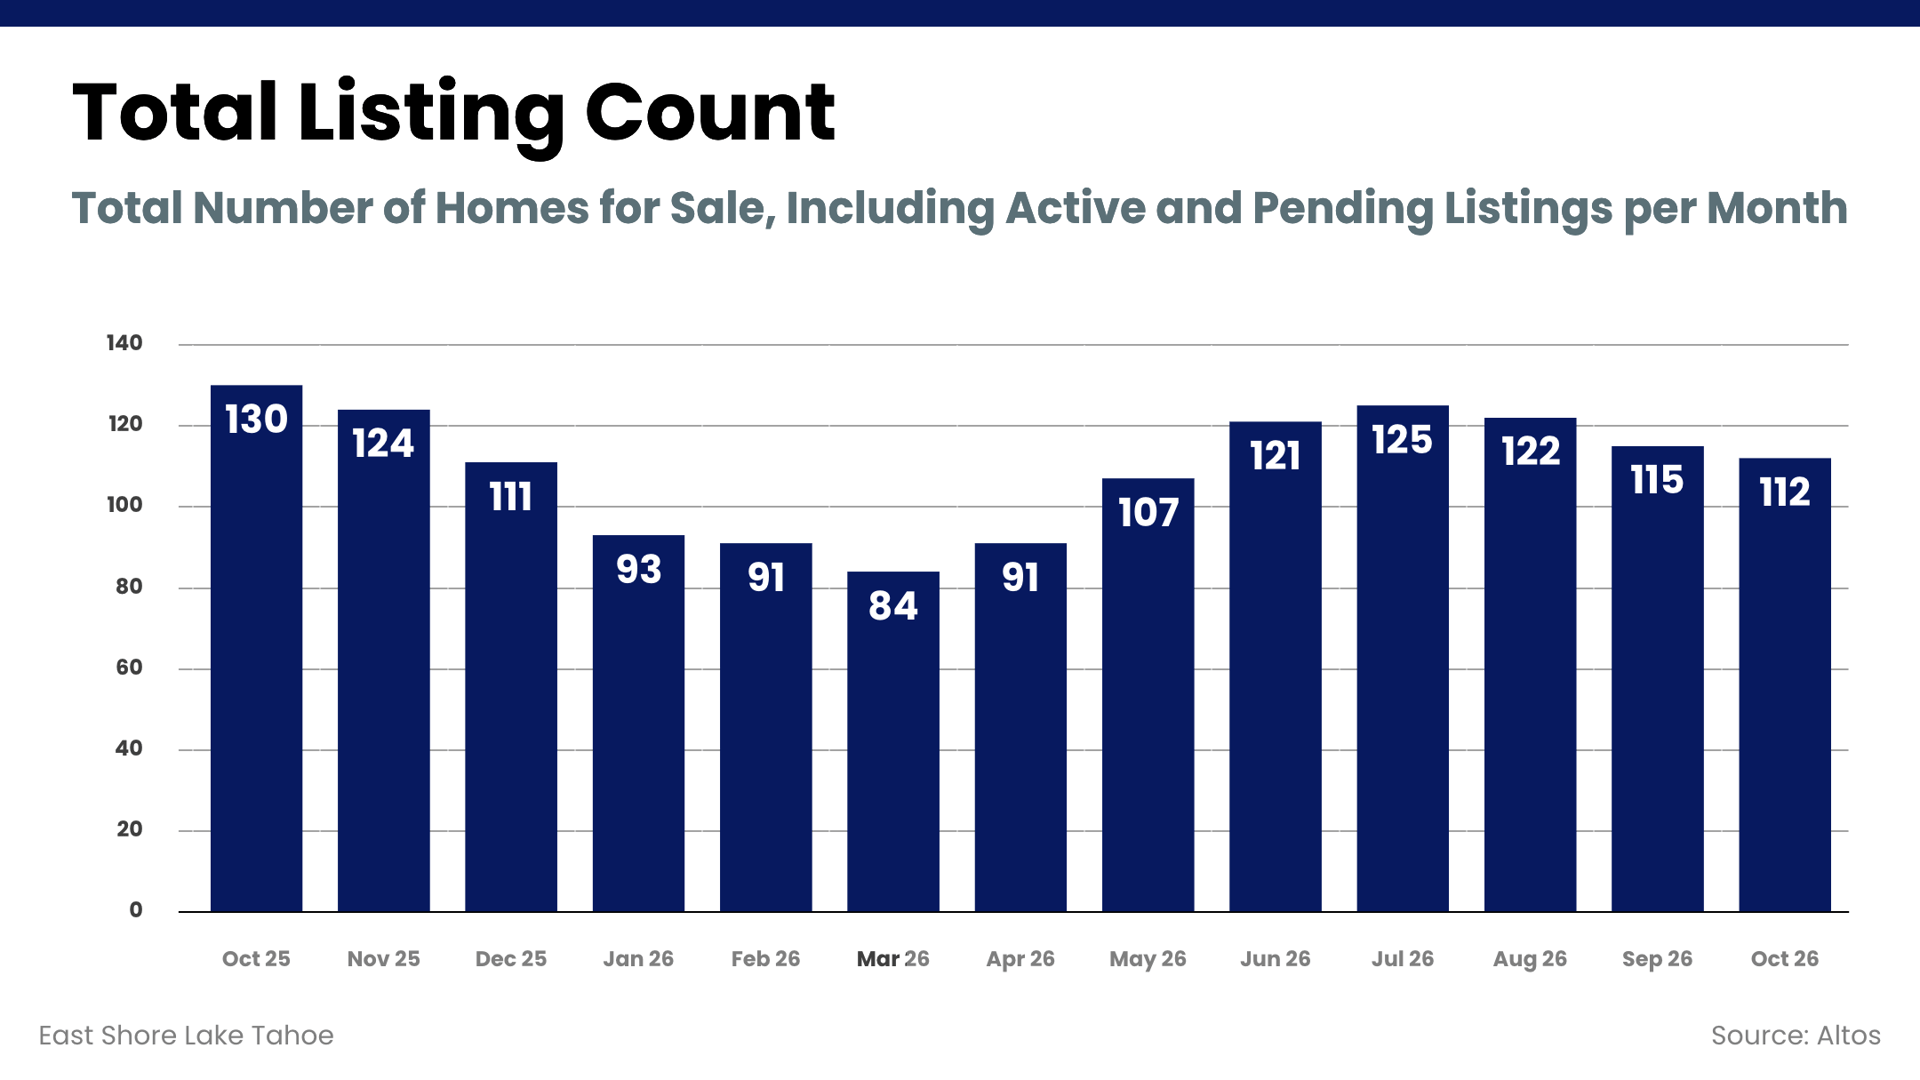 Total Listing Count: 112 homes (↓ from 115 in Sep)
Total inventory declined to 112 homes in October, approximately 14% below the 130 properties listed in October 2025. While inventory has followed its usual seasonal decline since July, the year-over-year difference is more significant.
The East Shore entered this fall with fewer properties on the market than a year ago, despite reaching a similar summer inventory peak. Buyers have a smaller overall selection, particularly as new listings become less frequent. For sellers, fewer competing properties can be an advantage, although the amount of available inventory relative to buyer activity remains an important consideration.
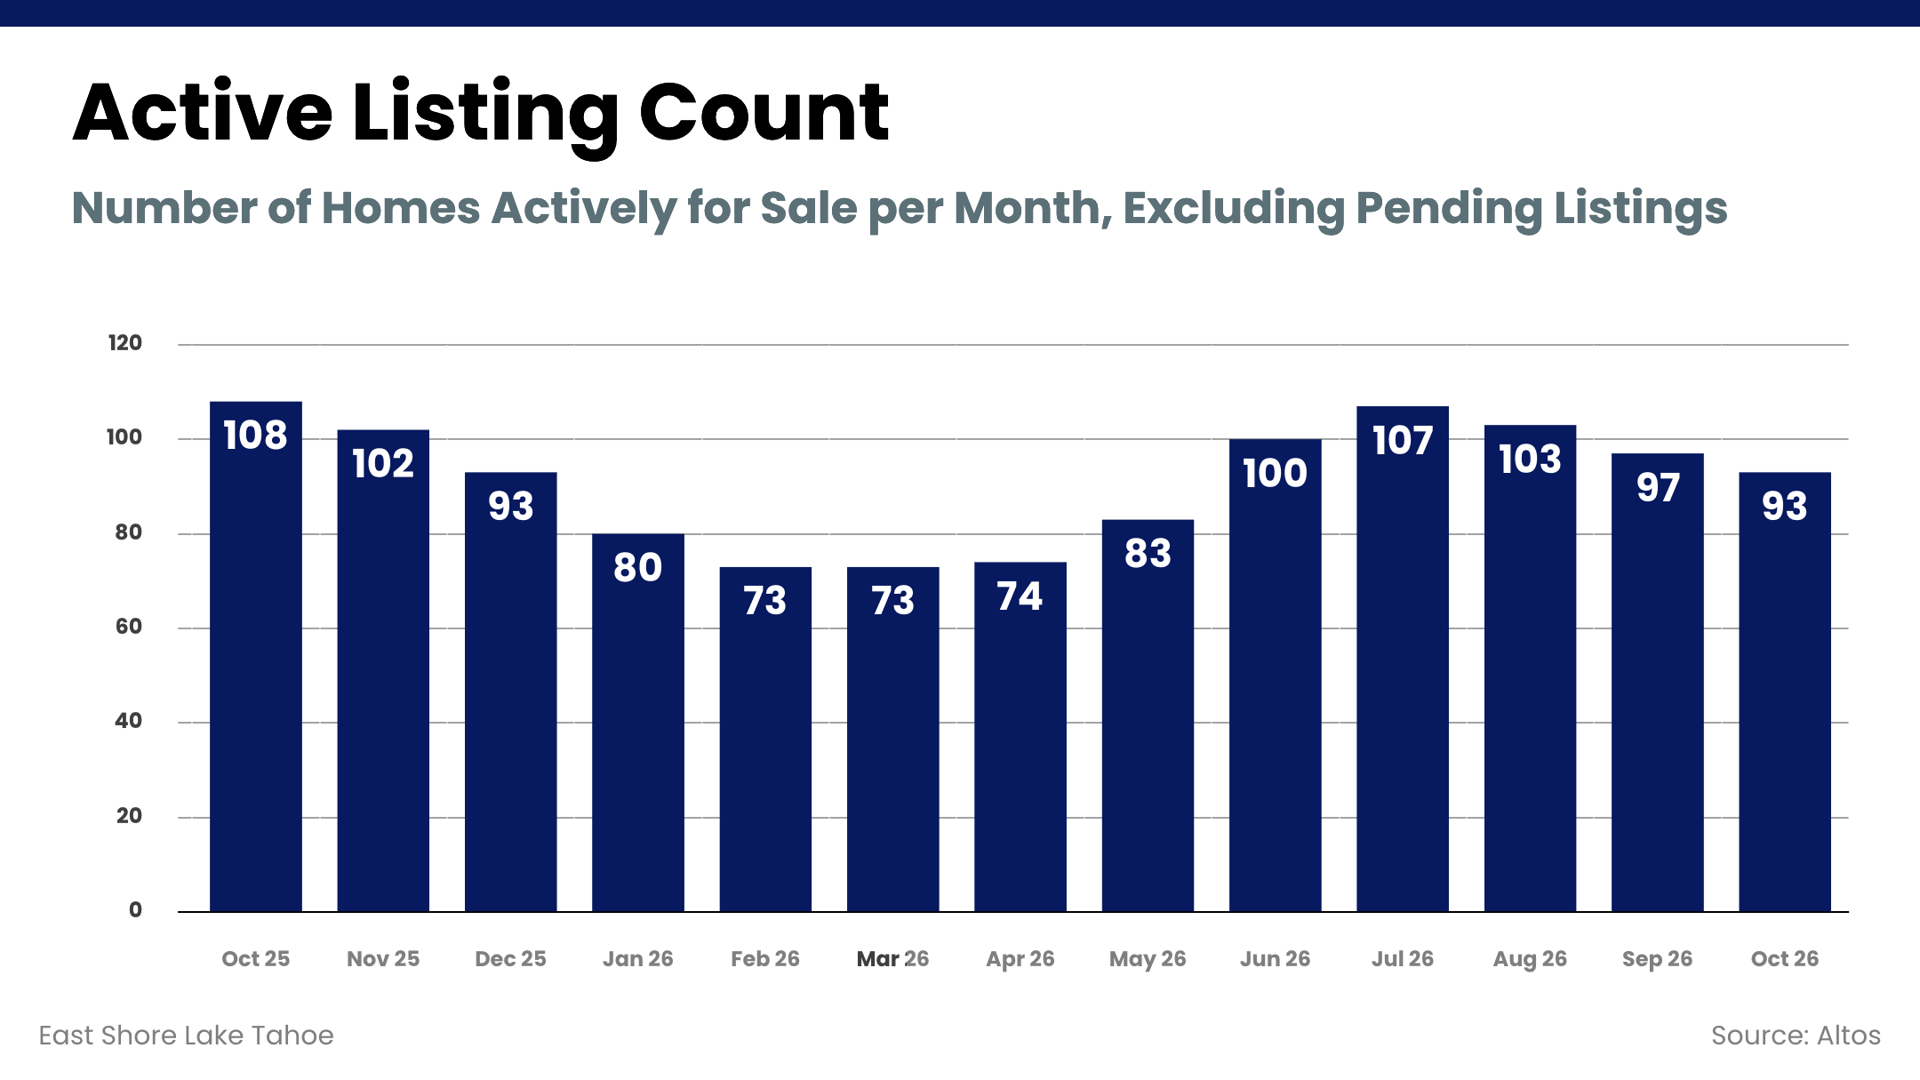 Active Listing Count: 93 homes (↓ from 97 in Sep)
Active listings totaled 93 in October, compared to 108 during the same month last year, a decline of nearly 14%. This marks a notable reduction in the number of properties immediately available for purchase.
With fewer homes competing for attention, sellers whose properties are well-positioned have an opportunity to stand out. However, lower inventory hasn't translated into faster sales or greater pricing power across the market. The increase in months of inventory compared to last year shows that buyers are still taking a measured approach, even with fewer properties available.
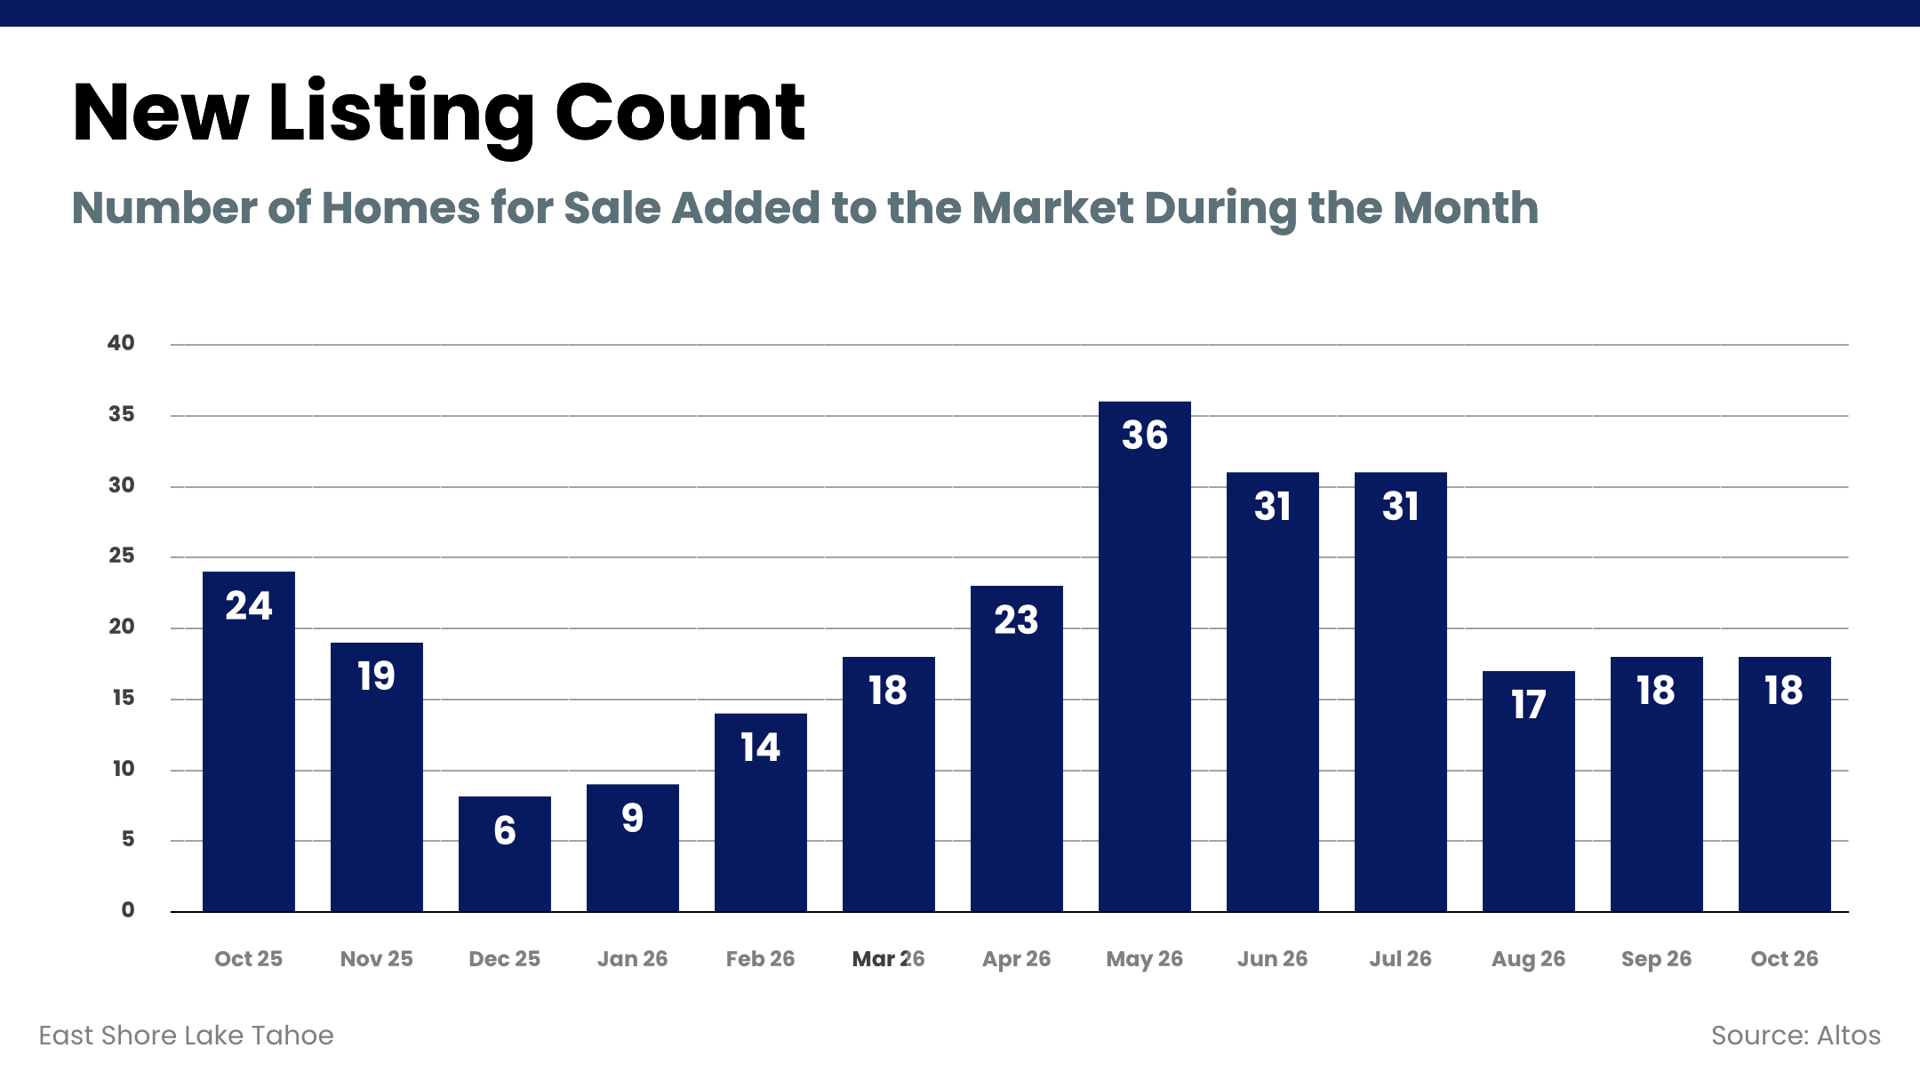 New Listing Count: 18 homes (Unchanged from Sep)
Only 18 new listings entered the market in October, compared to 24 in October 2025, a decrease of 25%. New listing activity has remained relatively quiet since August, following the much stronger pace we experienced during the spring and early summer.
The year-over-year decline means buyers have fewer fresh opportunities entering the market than they did last fall. This can benefit sellers whose properties are already listed, as there is less new competition for buyers' attention. It also means buyers searching for a particular location, property type, or price range may need to be more patient as we move into winter.
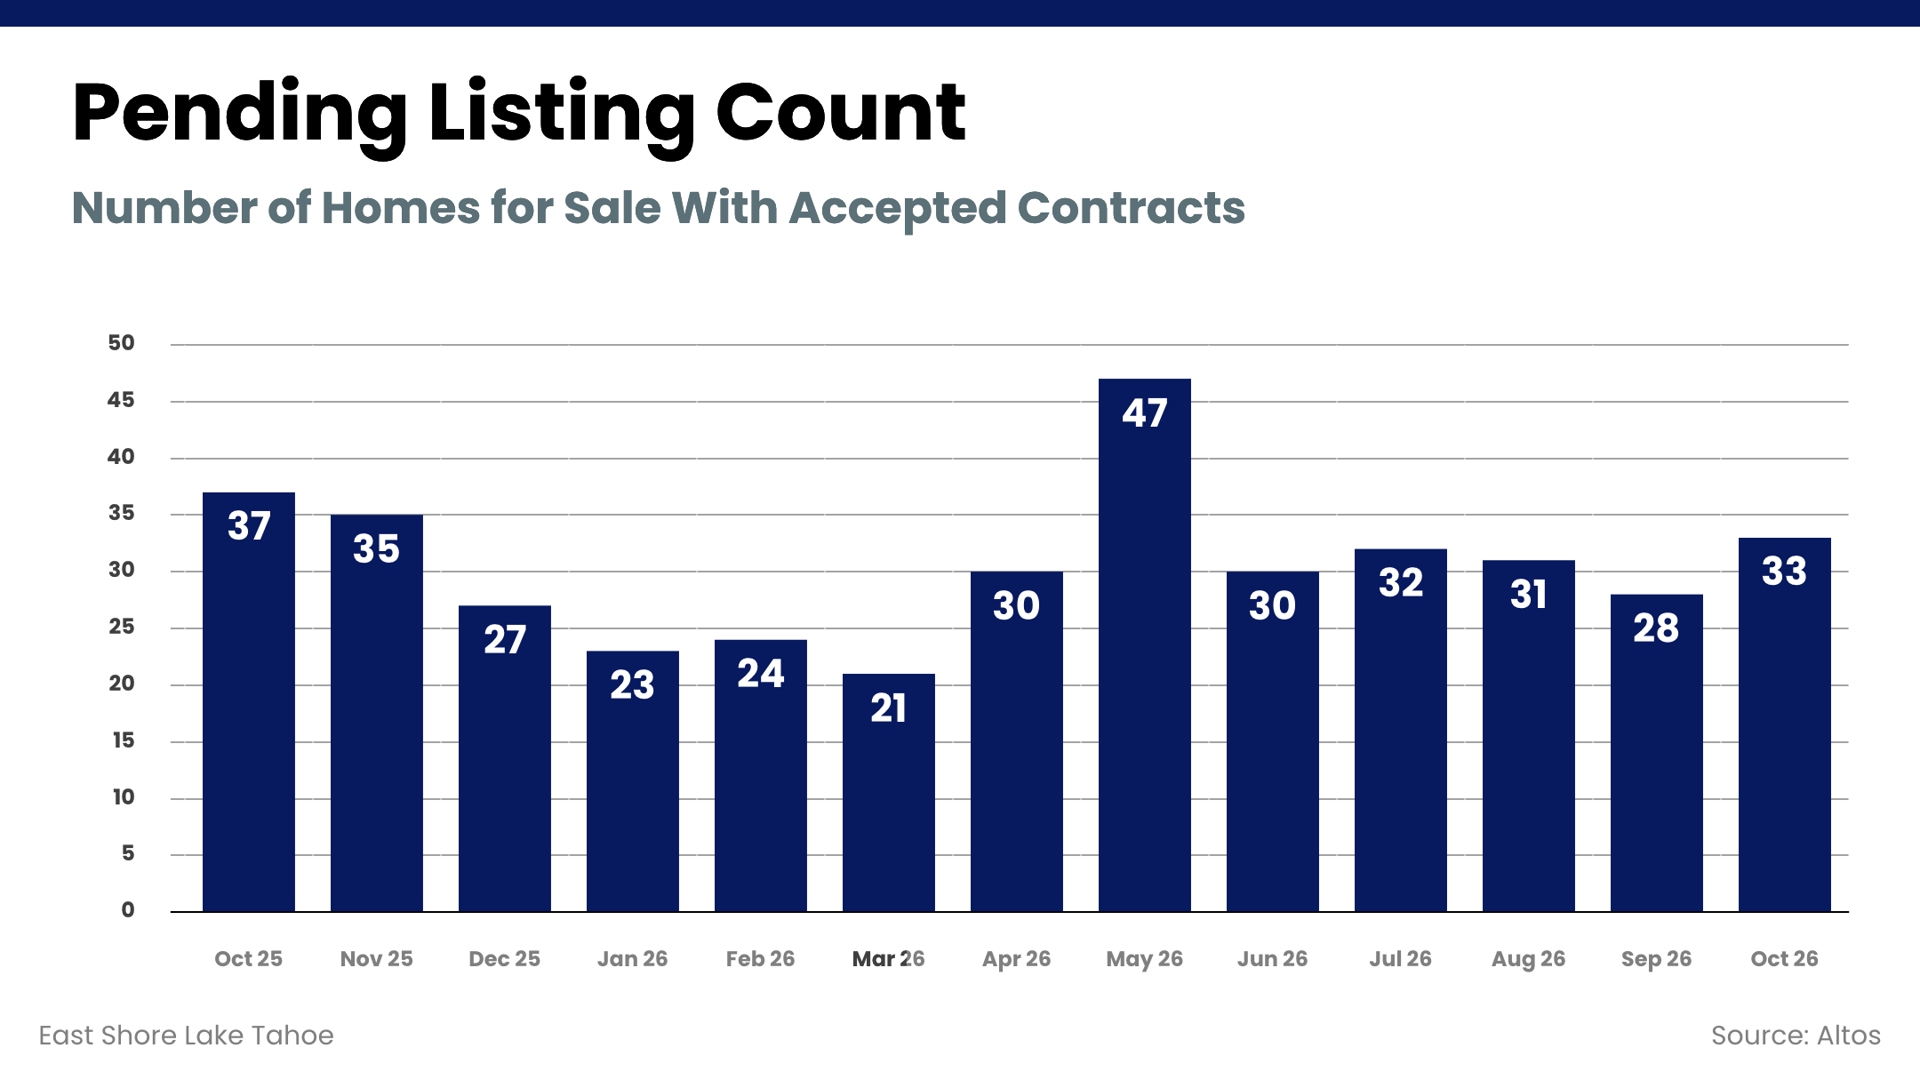 Pending Listing Count: 33 homes (↑ from 28 in Sep)
Pending listings increased to 33 in October, up from 28 in September but slightly below the 37 properties under contract in October 2025. This represents a year-over-year decline of approximately 11%, considerably smaller than the decrease in new listings.
The monthly increase is encouraging, particularly with fewer homes available for purchase. October recorded the highest pending count since May, demonstrating that buyers are still moving forward when they find the right property. While contract activity remains below last year's level, the difference is relatively modest compared to other changes in the market. This is a positive indication that demand remains present heading into the final months of the year.
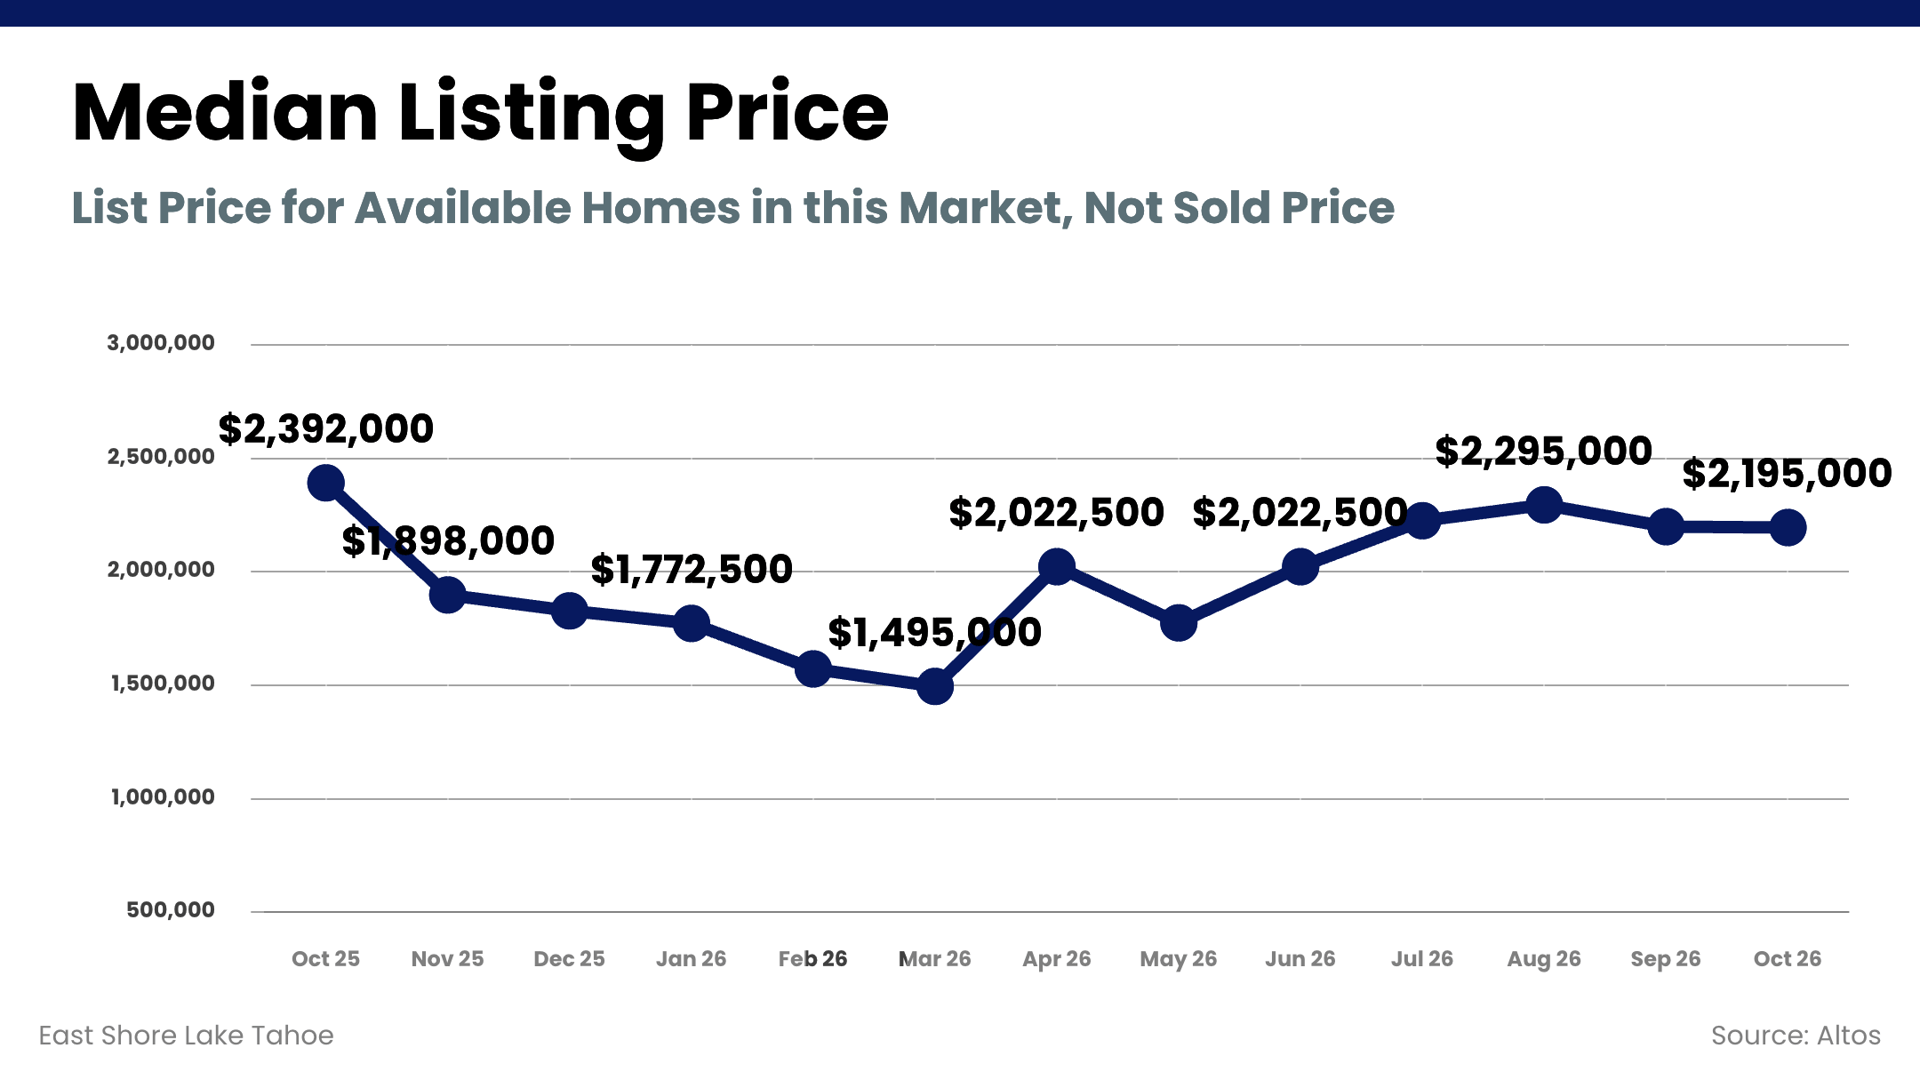 Median Listing Price: $2,195,000 (Unchanged from Sep)
The median asking price held steady at $2,195,000 in October, compared to $2,392,000 a year earlier. That's a decrease of approximately 8%, reflecting a lower overall price point among properties currently offered for sale.
Unlike sale prices, which reflect completed transactions, listing prices represent sellers' current expectations. Changes in the mix of available properties, particularly in a market with a wide range of home values, can significantly influence the median. Still, when considered alongside the larger decline in asking prices per square foot, the year-over-year difference shows that today's inventory is being offered at lower price levels than last fall.
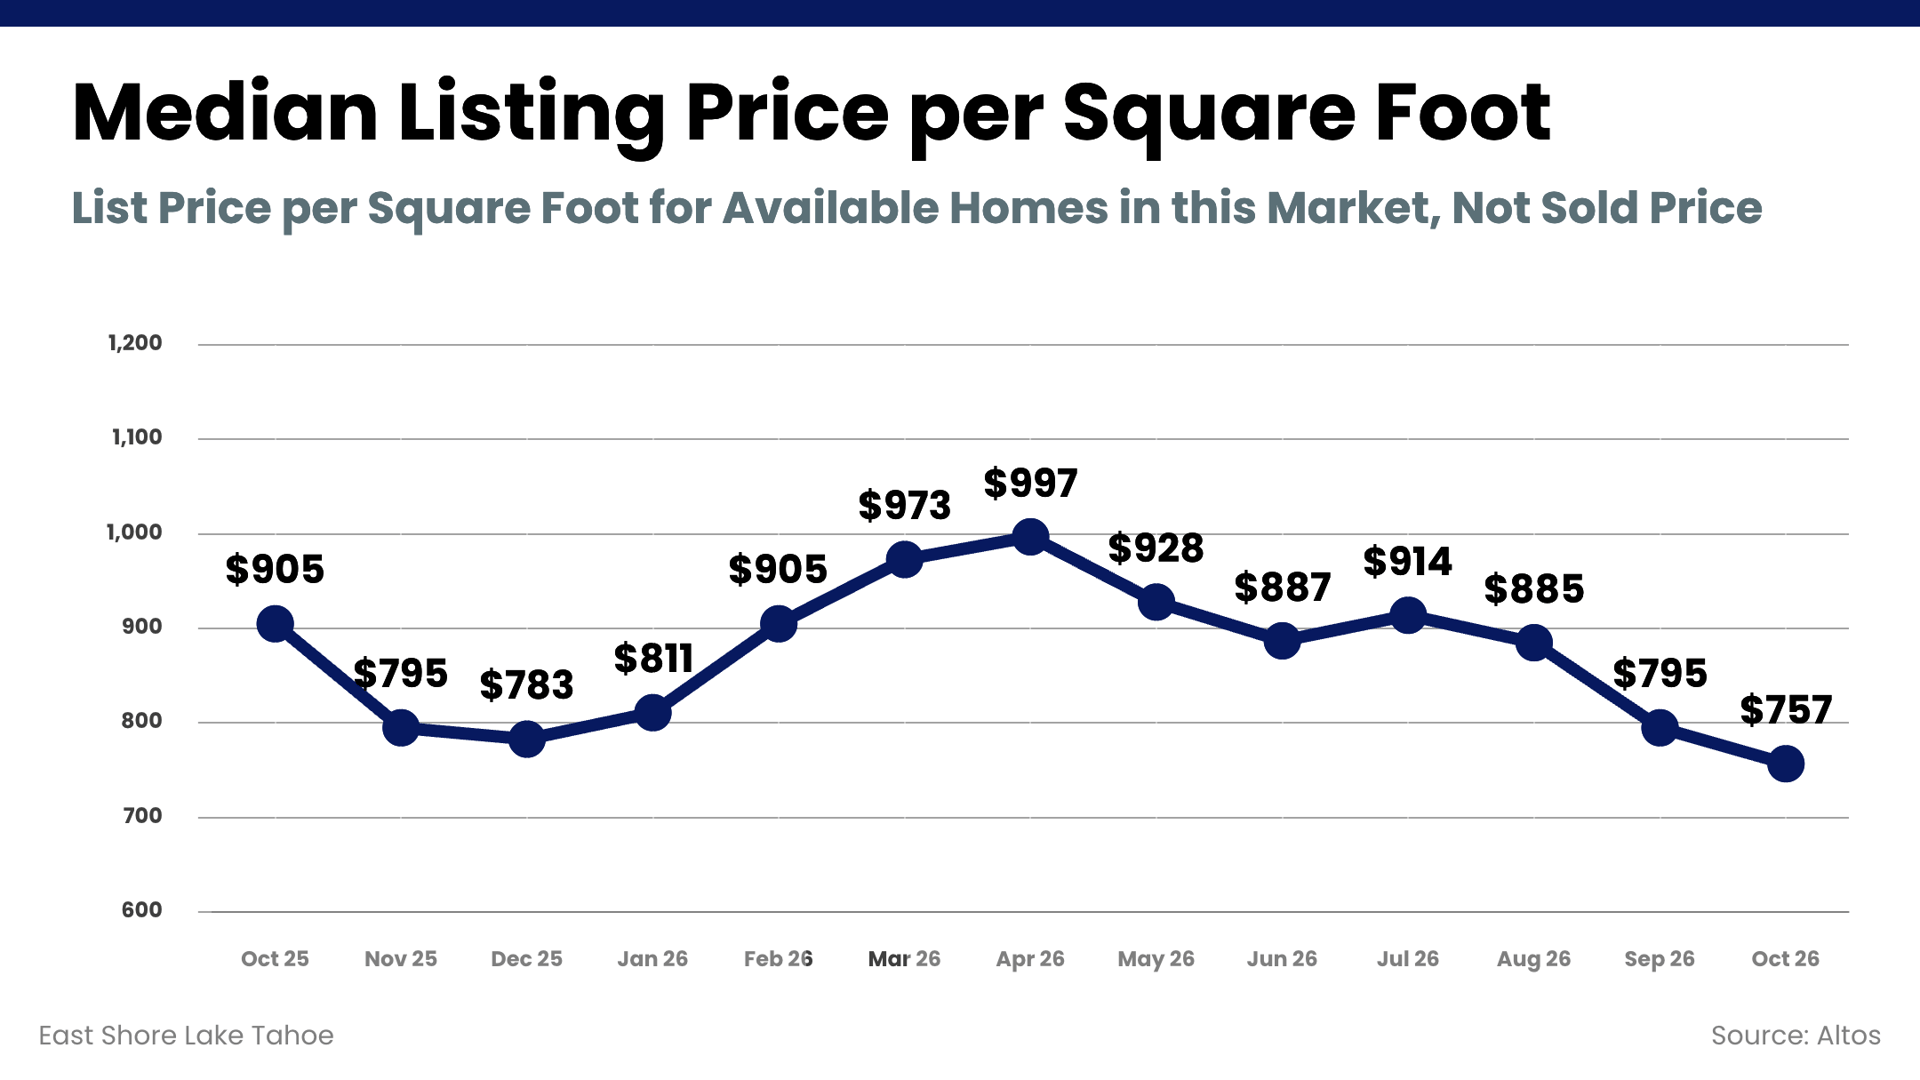 Median Listing Price per Square Foot: $757 (↓ from $795 in Sep)
The median asking price per square foot fell to $757 in October, compared to $905 in October 2025, a decrease of more than 16%. This is one of the most significant year-over-year changes in the October market data and the lowest reading in the 13-month period shown.
The decline has also been consistent in recent months, with asking prices per square foot falling from $914 in July to $757 in October. Although differences in property size, condition, location, and the composition of available inventory influence this measurement, the trend reflects a meaningful shift in how homes are currently priced.
For buyers, this provides a reason to revisit properties that may have been beyond their preferred price range earlier in the year. Sellers should pay close attention to the pricing of current competing properties rather than relying on the higher asking prices seen last fall or during the spring.
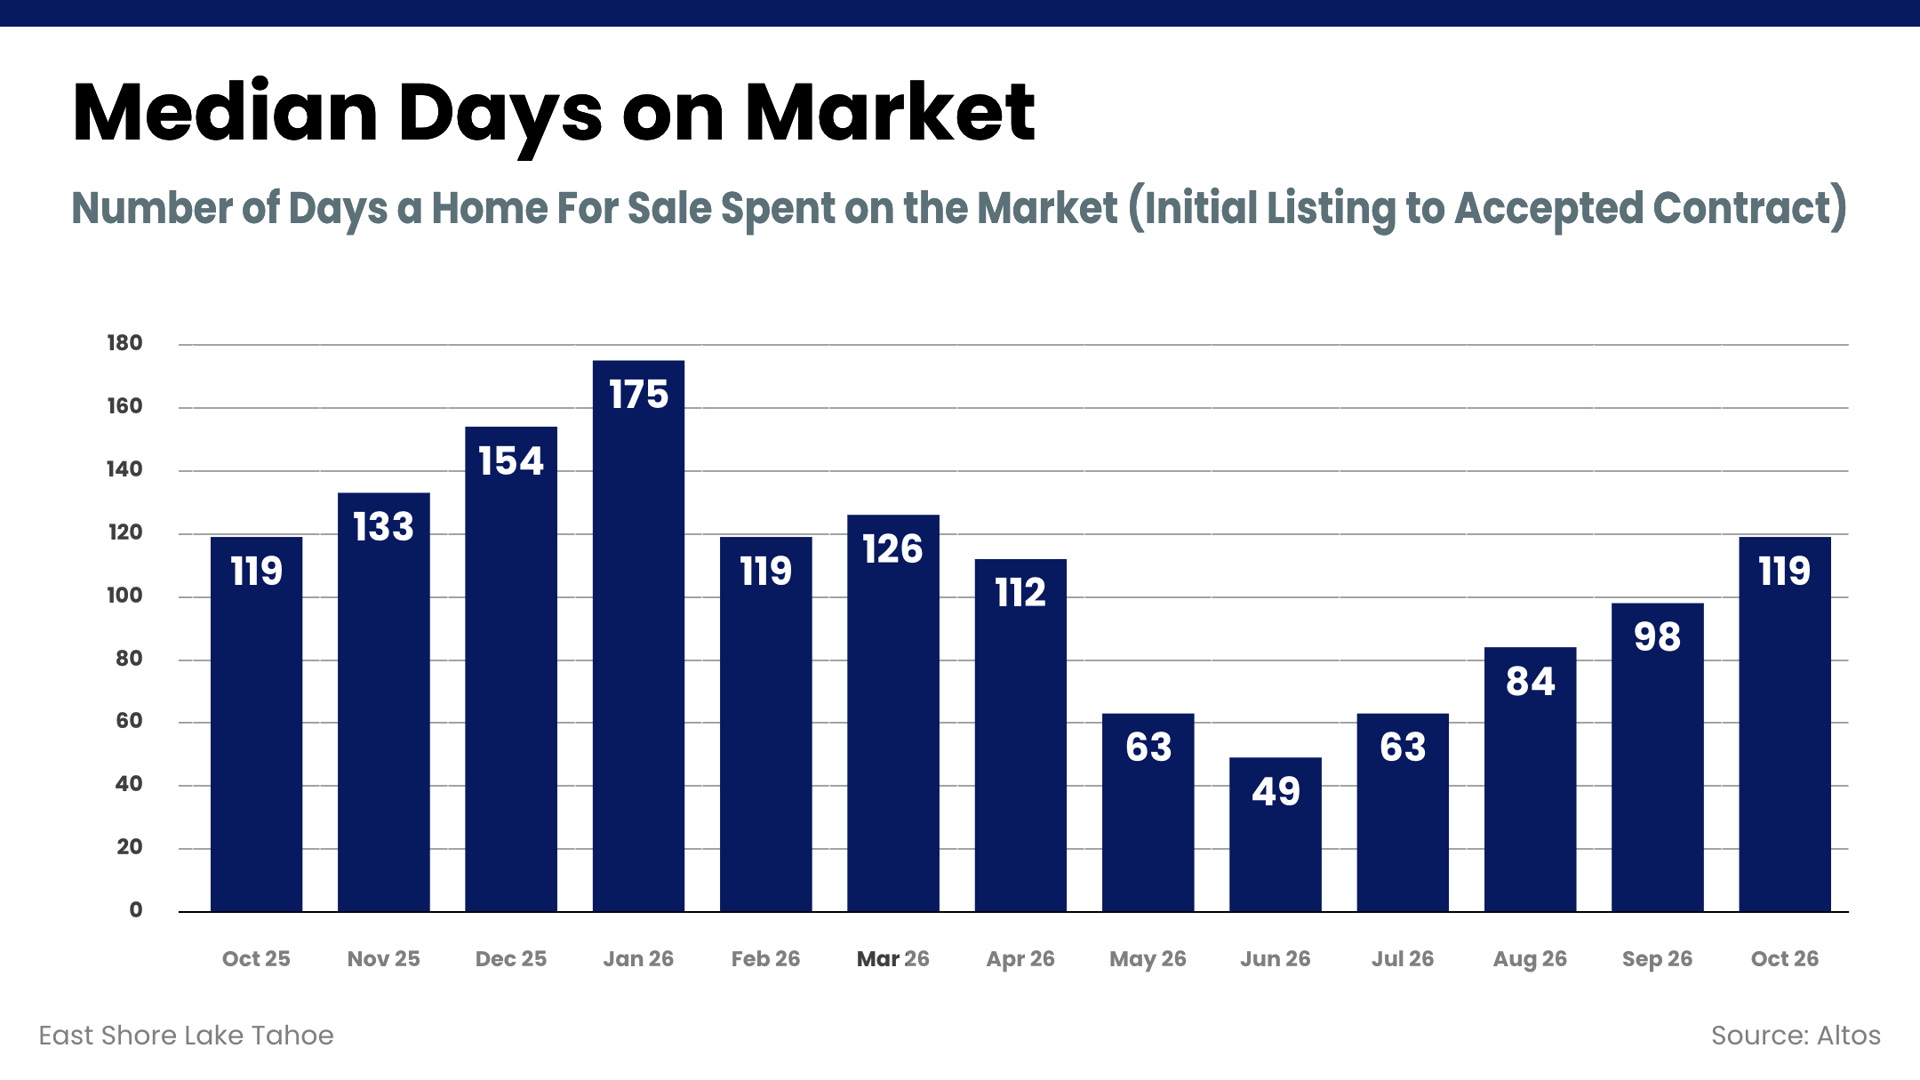 Median Days on Market: 119 days (↑ from 98 in Sep)
Median days on market reached 119 in October, exactly matching October 2025. Although marketing times have increased steadily since June, the year-over-year comparison provides a different perspective on that change.
The longer marketing periods we're experiencing this fall are not unusual for this time of year. October's figure is identical to last year's, suggesting that the recent increase is largely consistent with the market's seasonal rhythm rather than evidence of an unusually sharp slowdown.
For sellers, this is an important distinction. A property taking several months to secure a contract is not necessarily underperforming in the current market. Pricing, condition, location, and competition still play a major role, but expectations should reflect the pace typical of the fall and winter seasons.
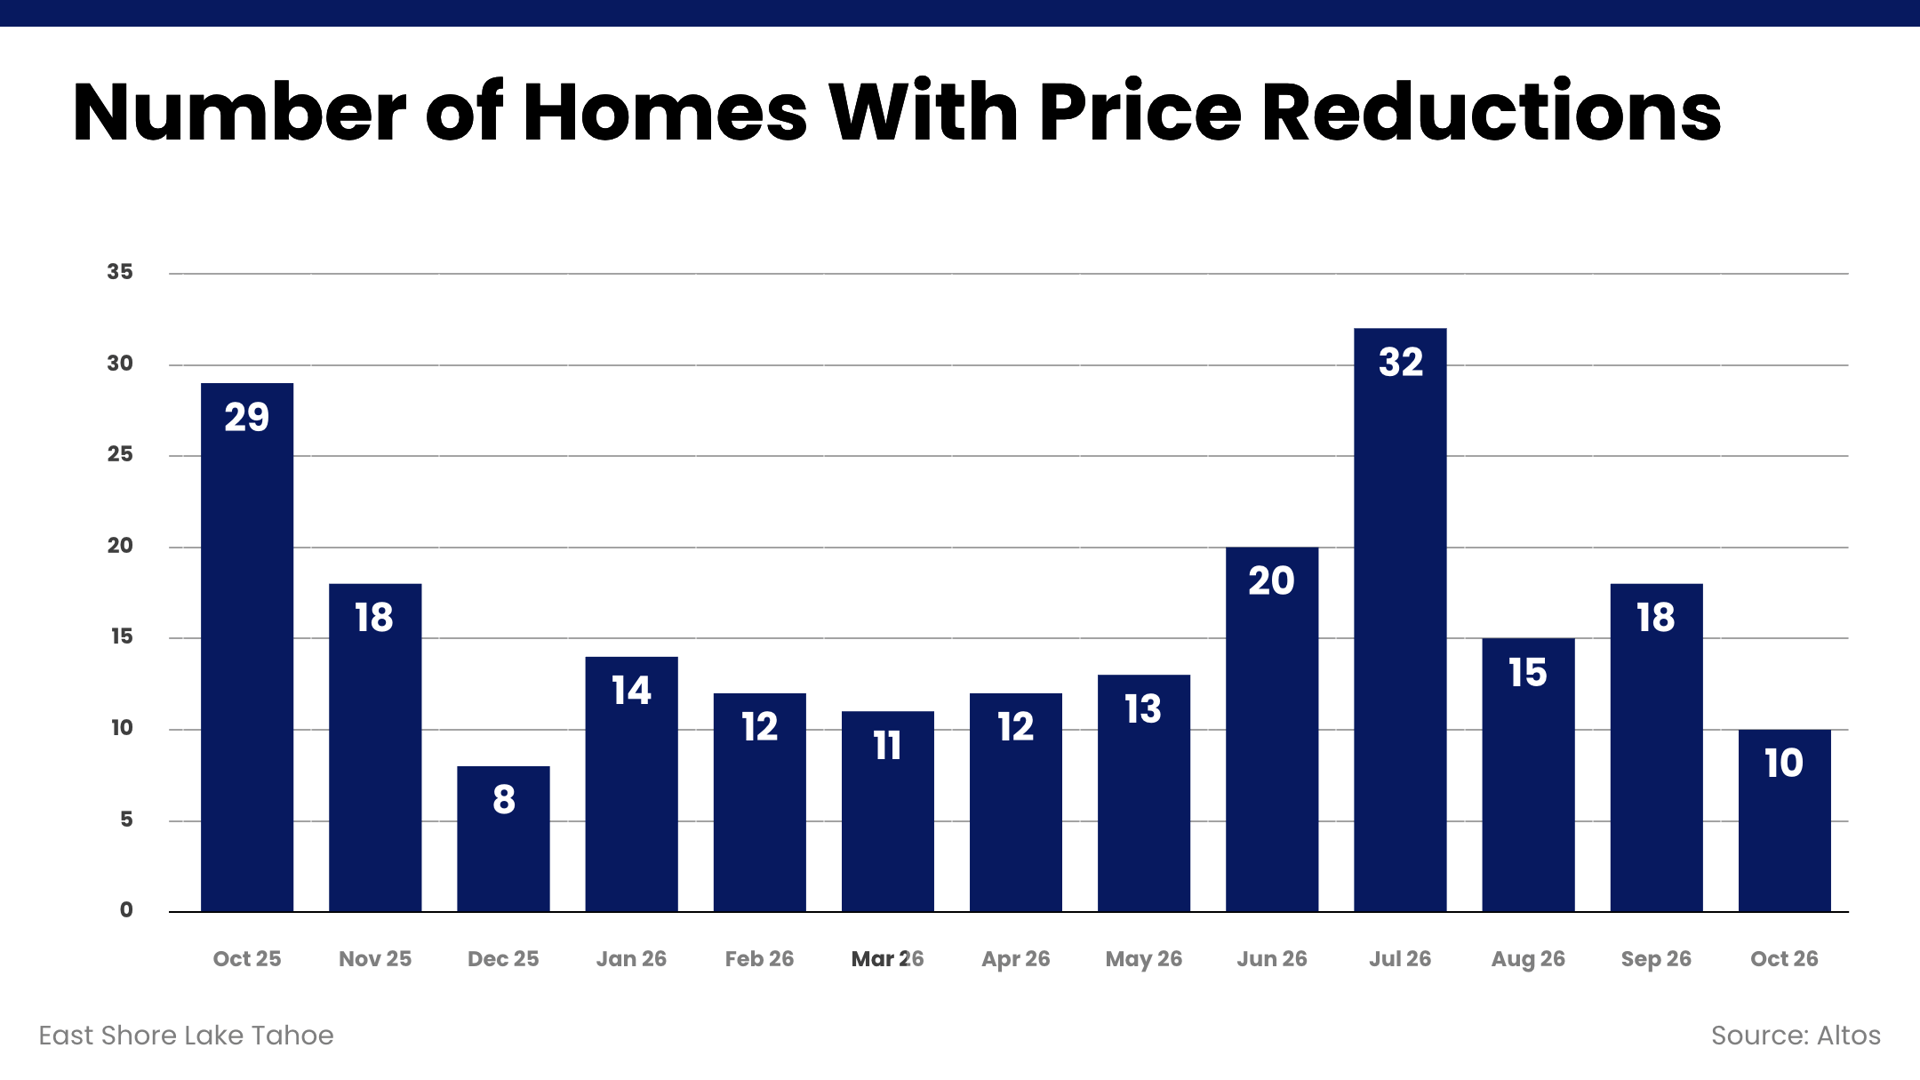 Number of Homes With Price Reductions: 10 homes (↓ from 18 in Sep)
Price reductions declined to just 10 in October, compared to 29 during the same month last year. That's a decrease of approximately 66%, making it one of the largest year-over-year changes among the October indicators.
The sharp decline is particularly interesting given that asking prices per square foot are also considerably lower than a year ago. With fewer active listings and fewer new properties entering the market, there are fewer homes competing for buyers' attention. Sellers may also be entering the market with pricing that better reflects current conditions or may have already adjusted their prices earlier in the season.
While fewer price reductions are generally a positive sign, they shouldn't be interpreted as evidence that sellers have regained significant negotiating leverage. The broader market continues to show longer marketing periods and more months of inventory than last October. Accurate initial pricing remains important, particularly for properties competing with established listings.
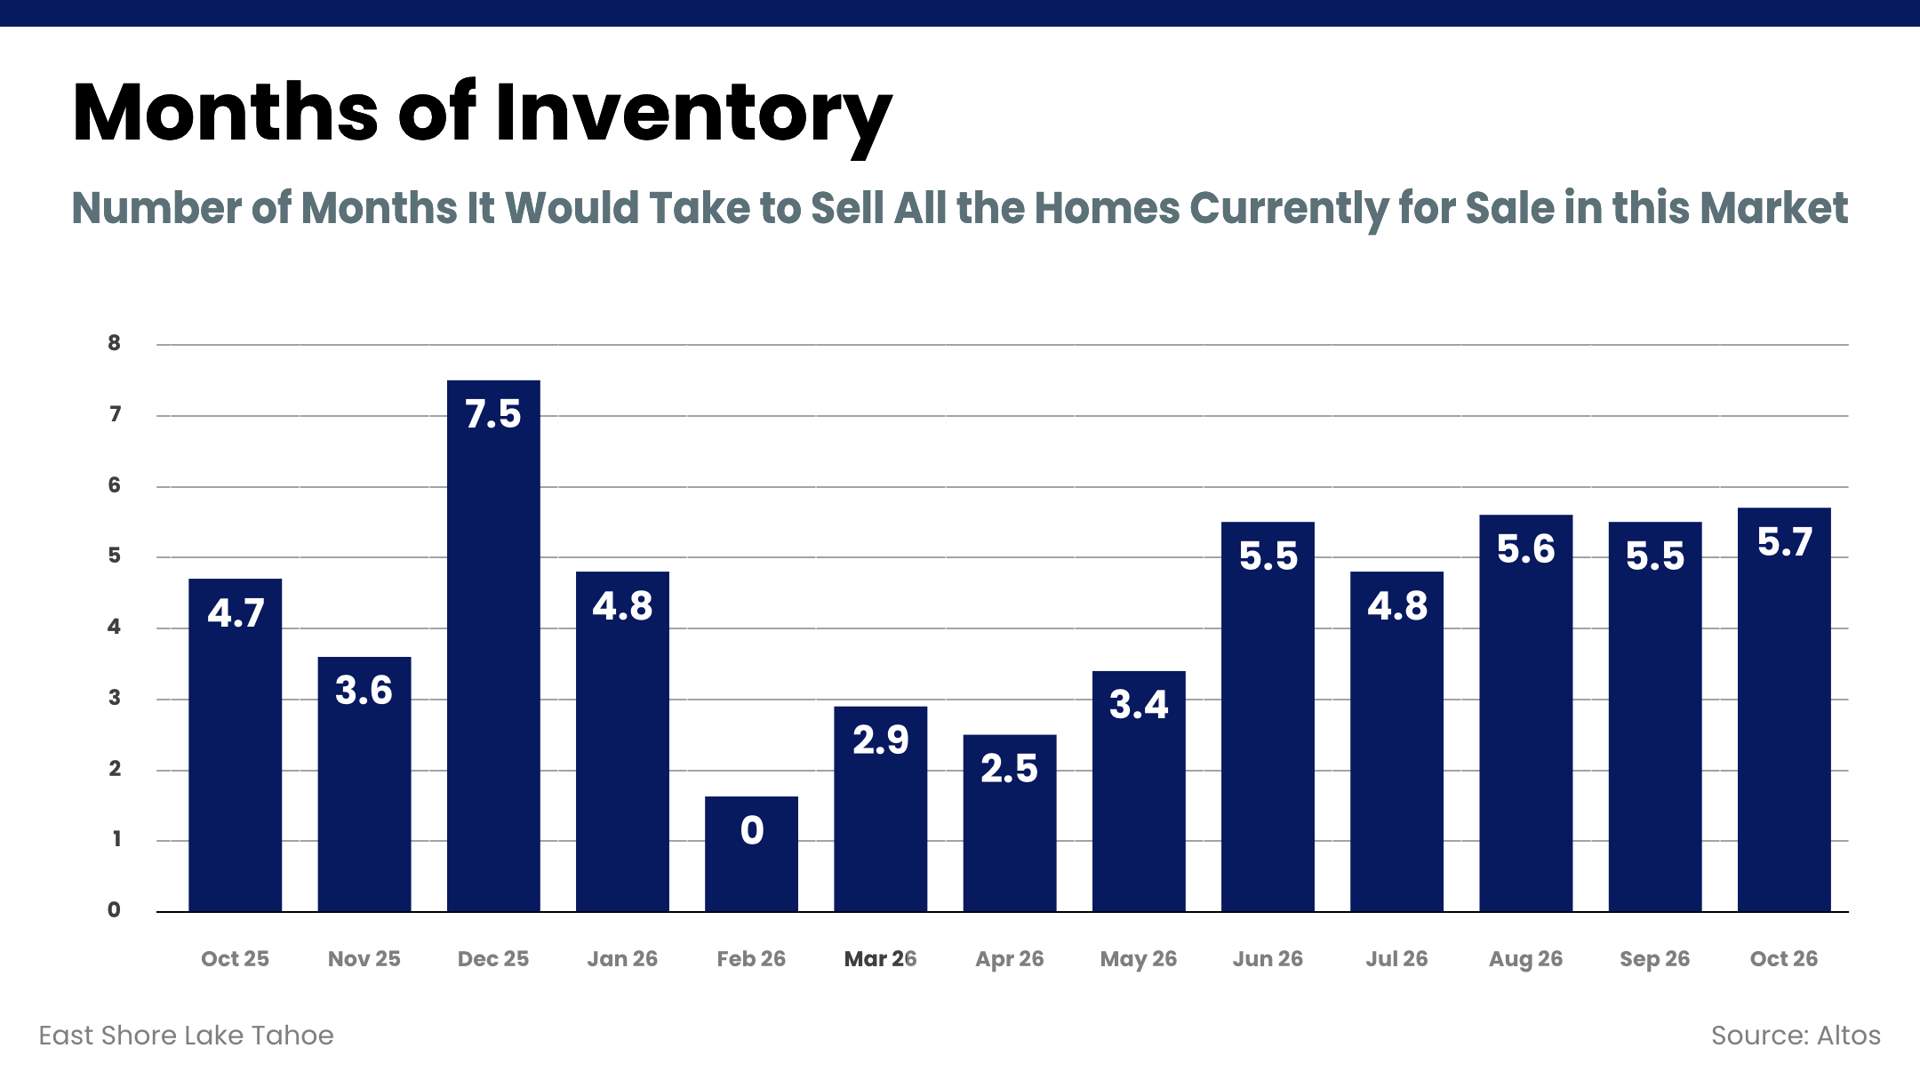 Months of Inventory: 5.7 months (↑ from 5.5 in Sep)
Months of inventory increased to 5.7 in October, compared to 4.7 months in October 2025. That's an increase of approximately 21%, despite the fact that the number of available properties has declined over the same period.
This is one of the most revealing comparisons in October's report. Months of inventory measures the relationship between available supply and the pace of sales. When this figure increases while the number of listings decreases, it indicates that the market is absorbing available inventory more slowly.
At 5.7 months, the East Shore remains near a balanced market overall, but buyers have more supply relative to the pace of sales than they did a year ago. This helps explain why lower inventory has not resulted in stronger pricing or shorter marketing times. Conditions still vary substantially by neighborhood, property type, and price range, making individual property analysis particularly important.
The October numbers highlight an important distinction between having fewer homes for sale and having a stronger seller's market. Compared to last year, East Shore inventory is down approximately 14%, yet months of inventory has increased by more than 21%. There are fewer properties available, but the market is absorbing them at a slower pace relative to supply.
Pricing is another area where the year-over-year changes stand out. Median asking prices are approximately 8% lower than last October, while asking prices per square foot have declined more than 16%. These figures reflect changes in the current selection of homes rather than a direct measurement of property values, but they show that the pricing environment has shifted. At the same time, median days on market are identical to last October, indicating that the longer marketing periods we're seeing are consistent with the seasonal pace of the market.
There are also encouraging signs. Pending listings increased in October, reaching their highest level since May, and the number of price reductions was substantially lower than a year ago. Buyers remain active, and sellers are continuing to find success, even as the overall market operates at a more deliberate pace.
For buyers, the combination of lower asking prices, more months of inventory, and fewer competing new listings creates opportunities to take a closer look at available properties. For sellers, reduced competition is helpful, but understanding current market expectations remains essential. Well-priced, well-presented properties are in the best position to attract serious interest.
As we approach the end of 2026, the East Shore market remains relatively balanced, but it is operating under different conditions than a year ago. The year-over-year trends provide valuable perspective, and understanding how those broader changes apply to an individual property is the key to making informed real estate decisions.








Get In Touch