2025 in Graphs
East Shore Market Update | Year-End Snapshot (2025 vs 2024)
The data below reflects where the East Shore market stood as of December, closing out a year defined by visible inventory and measured pacing. Since the calendar turned, activity has already picked up noticeably. January has brought a steady stream of buyer and seller inquiries, signaling renewed engagement after the year-end pause. While the following snapshot looks backward at 2025, the tone of the market entering 2026 feels distinctly more active.
Below is a year-end snapshot comparing 2025 to 2024.
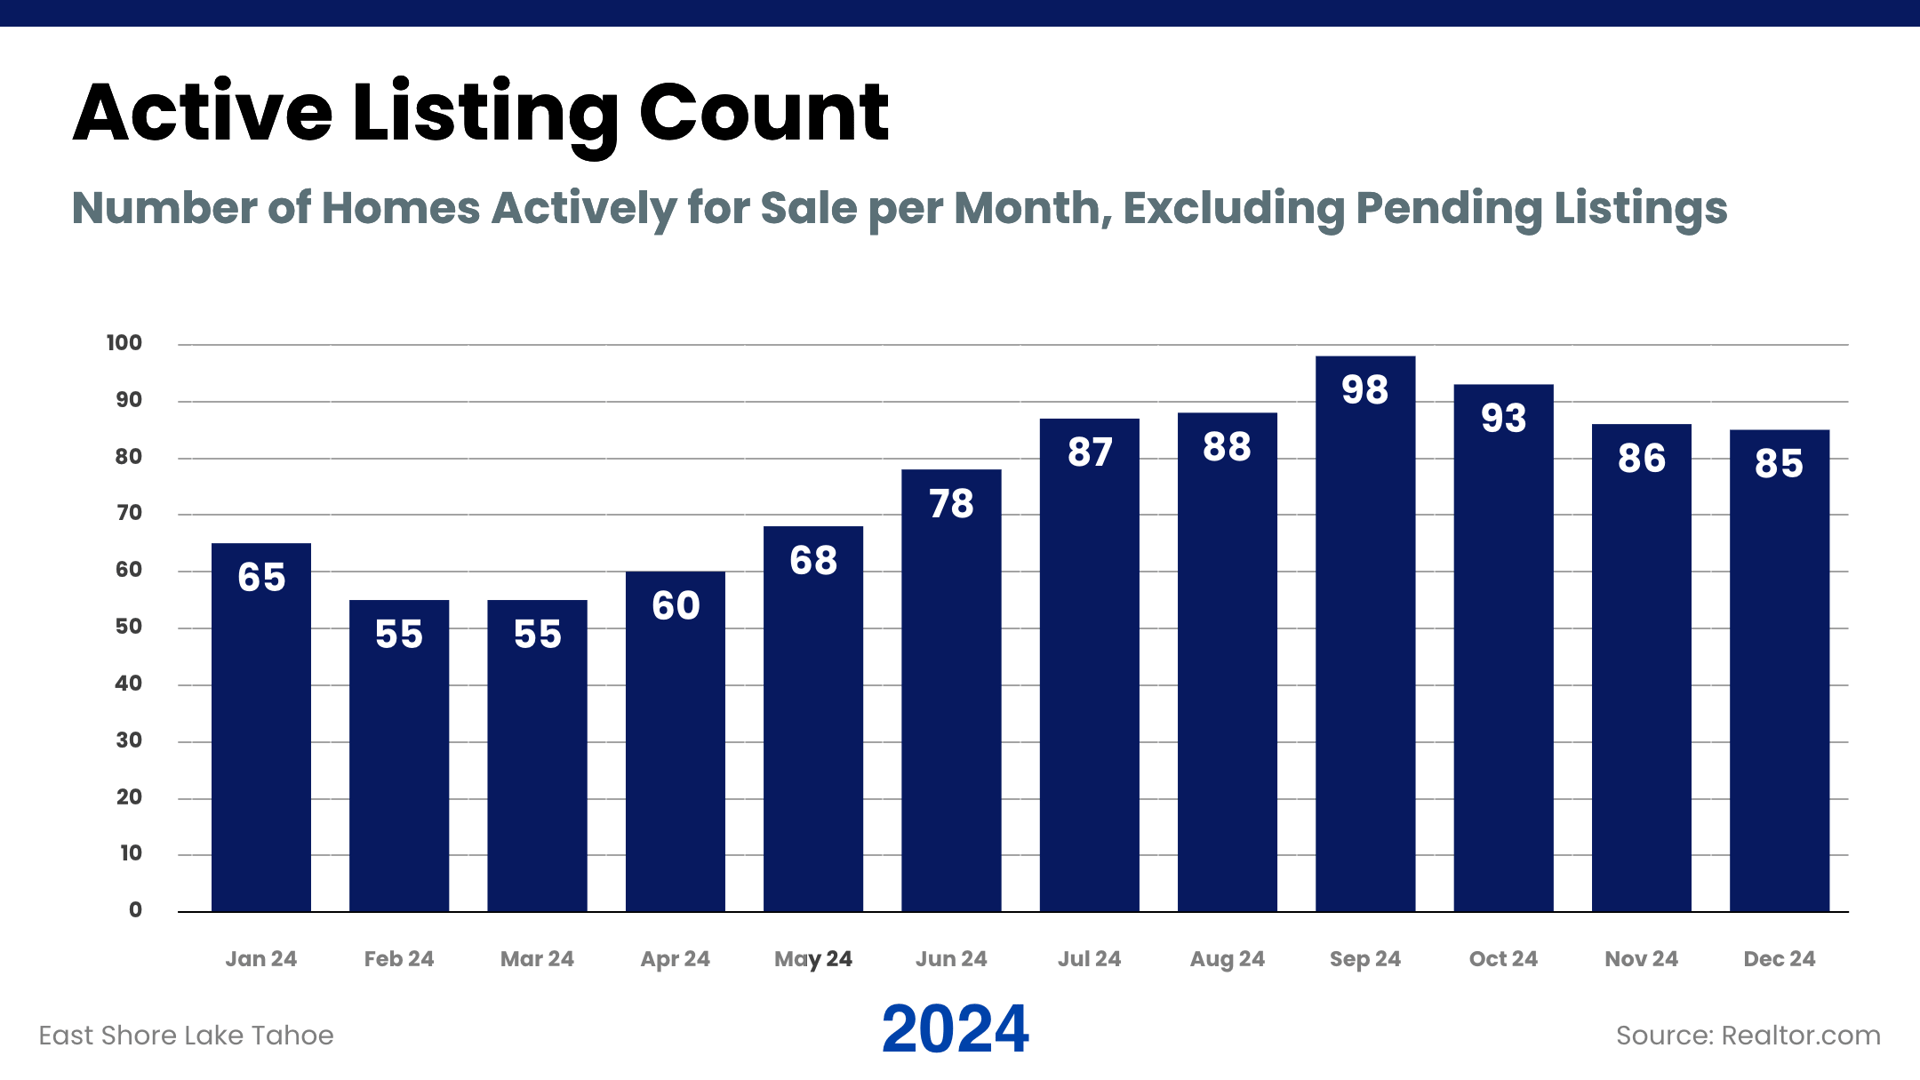
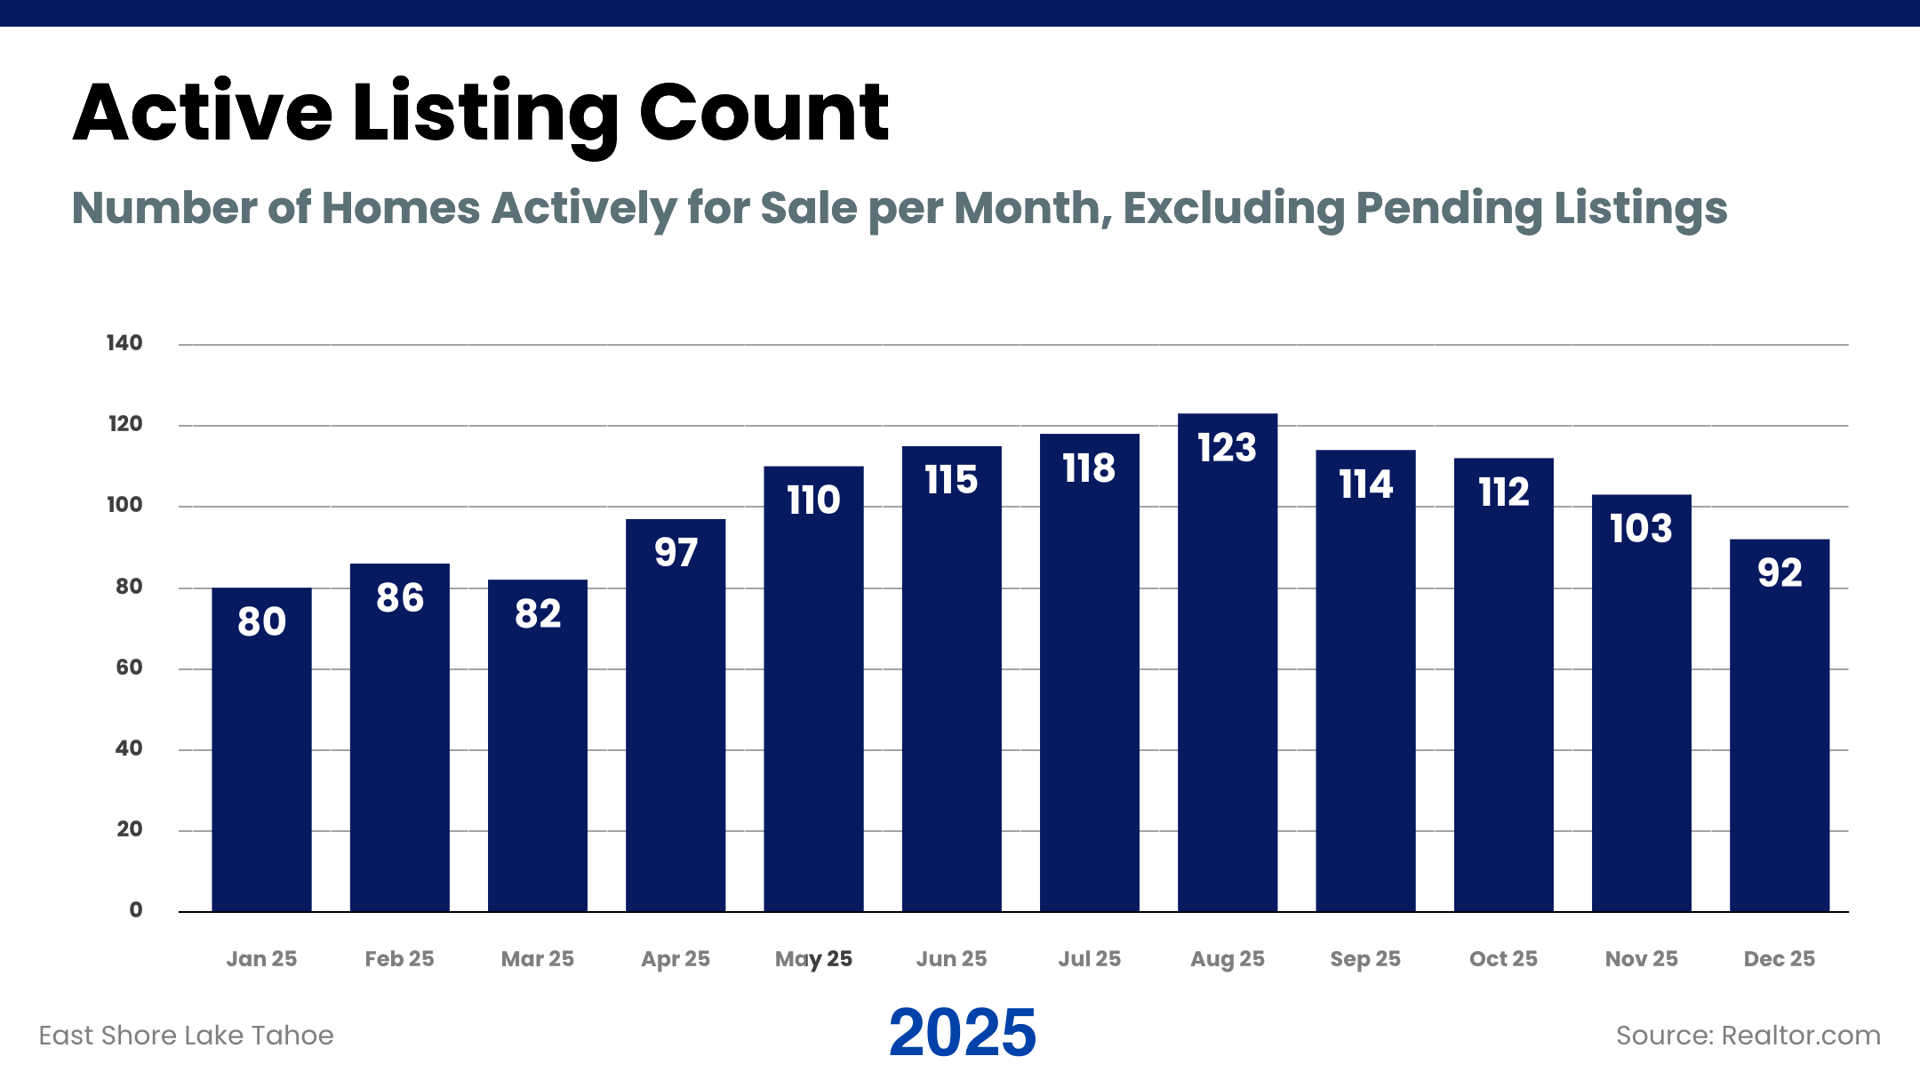
Throughout 2025, active inventory generally tracked higher than in 2024, particularly during the spring and summer months. More homes remained on the market at the same time, increasing overlap among comparable properties. This shift gave buyers more choice and made side-by-side comparison unavoidable.
For sellers, the elevated active count reinforced a consistent theme across the year: initial presentation and pricing accuracy mattered as much as timing.
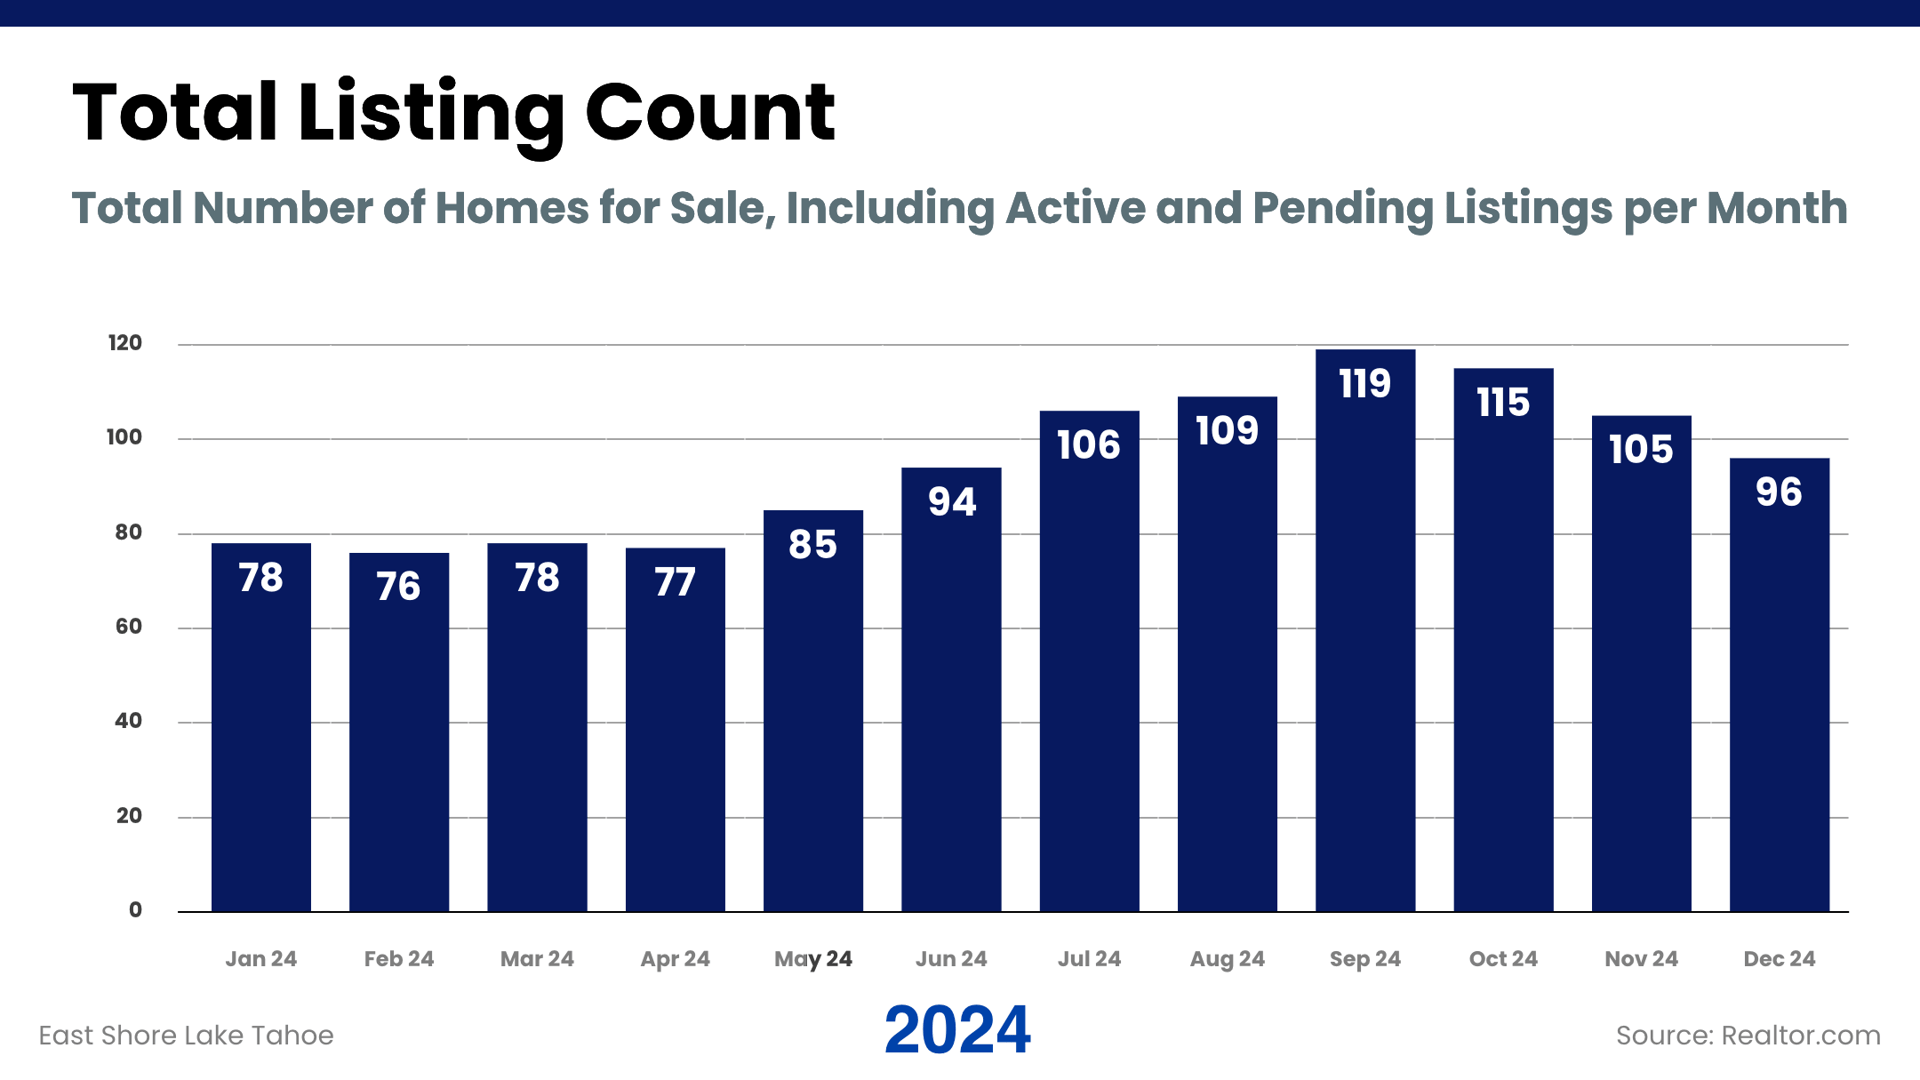
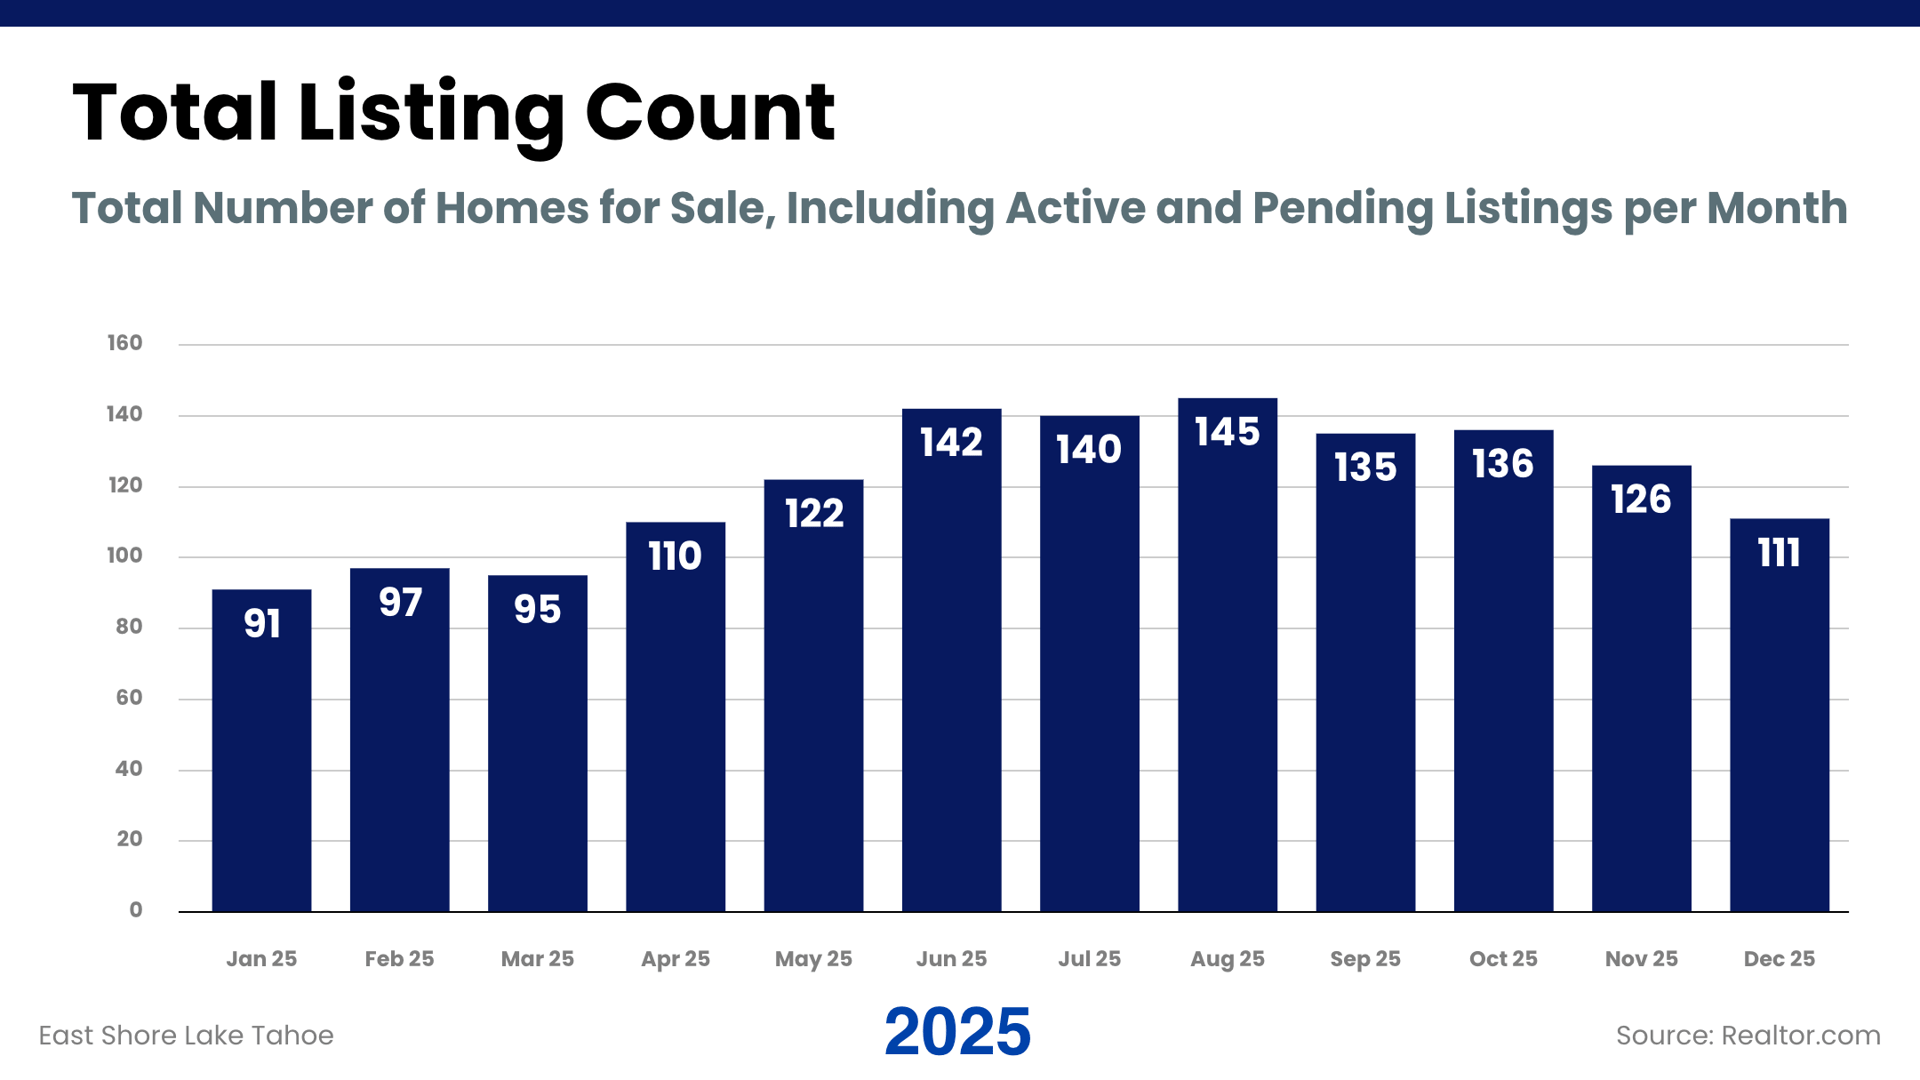
The total number of listings—including homes under contract—also ran higher in 2025 than in 2024 for much of the year. Buyers were able to observe alternatives, track price changes, and wait for alignment rather than feeling compelled to act immediately.
The broader listing pool did not signal weak demand, but rather a market that allowed more time for evaluation.
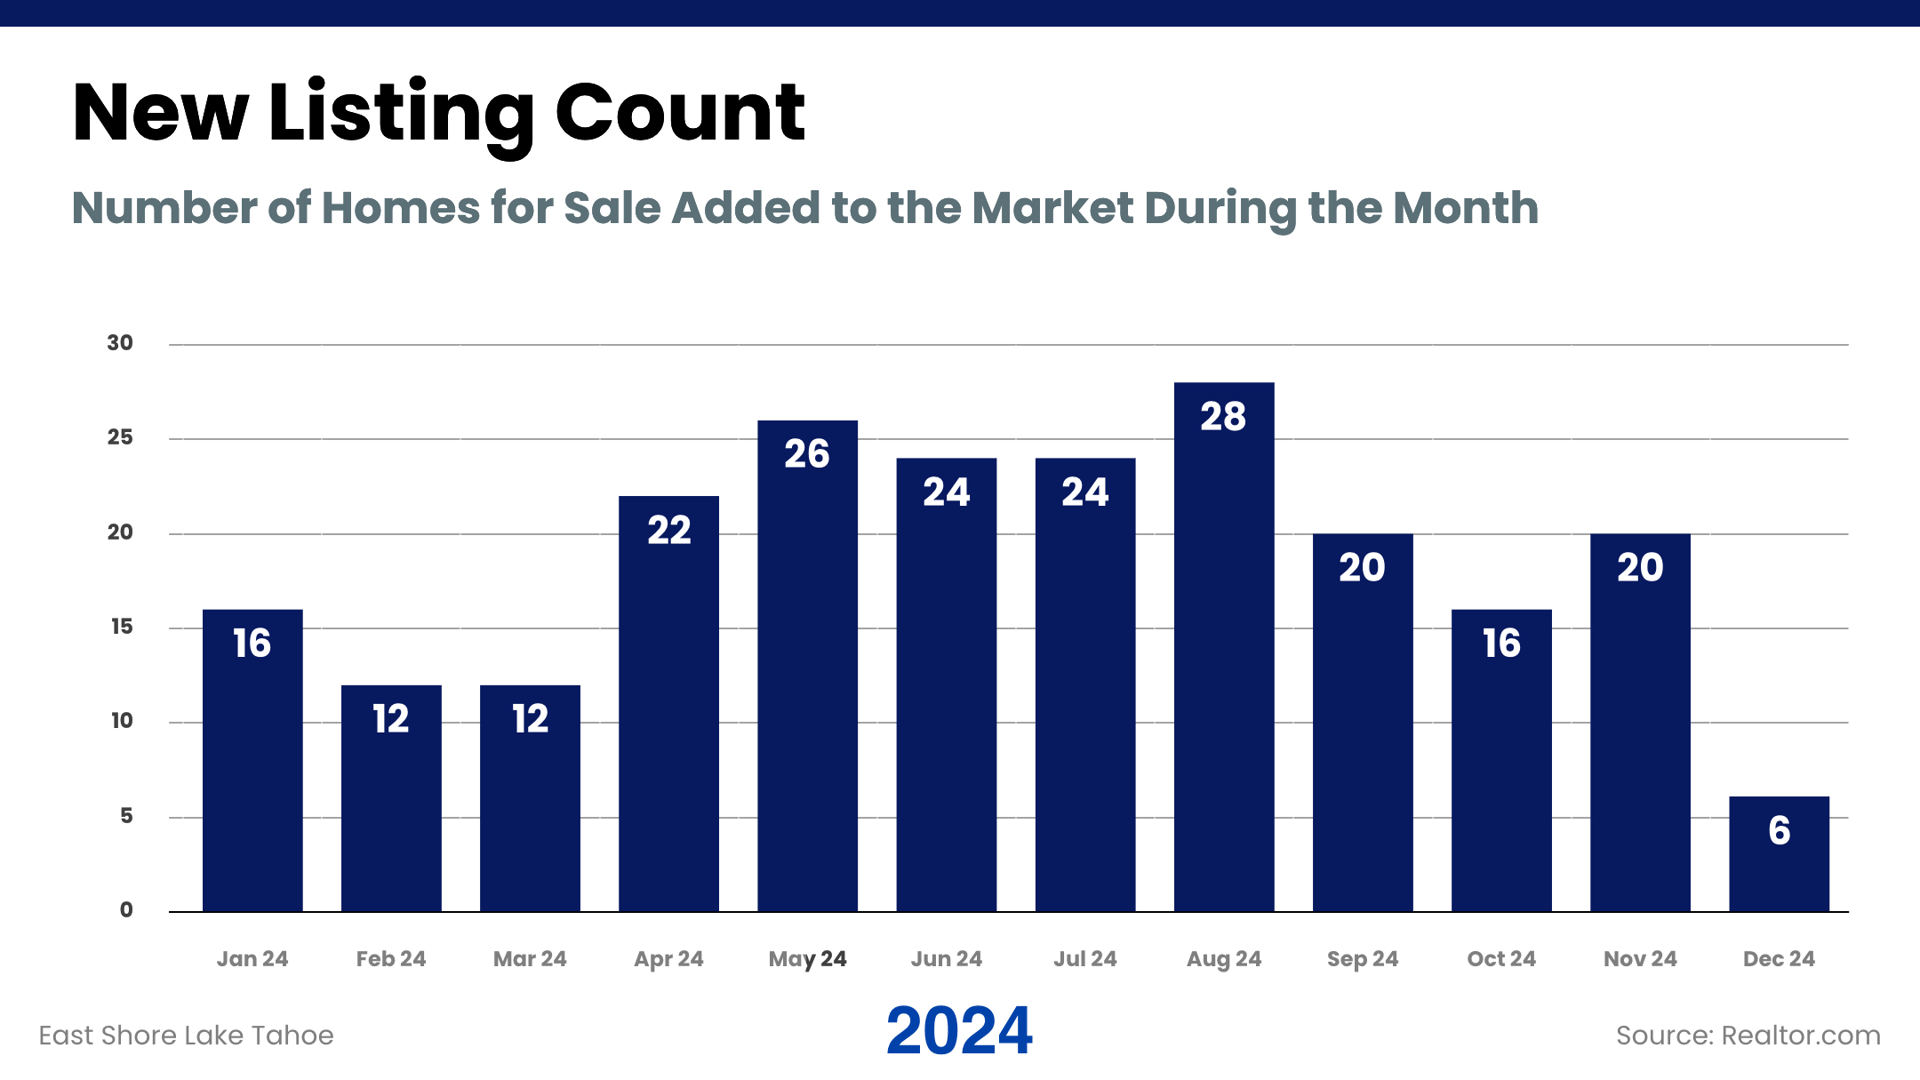
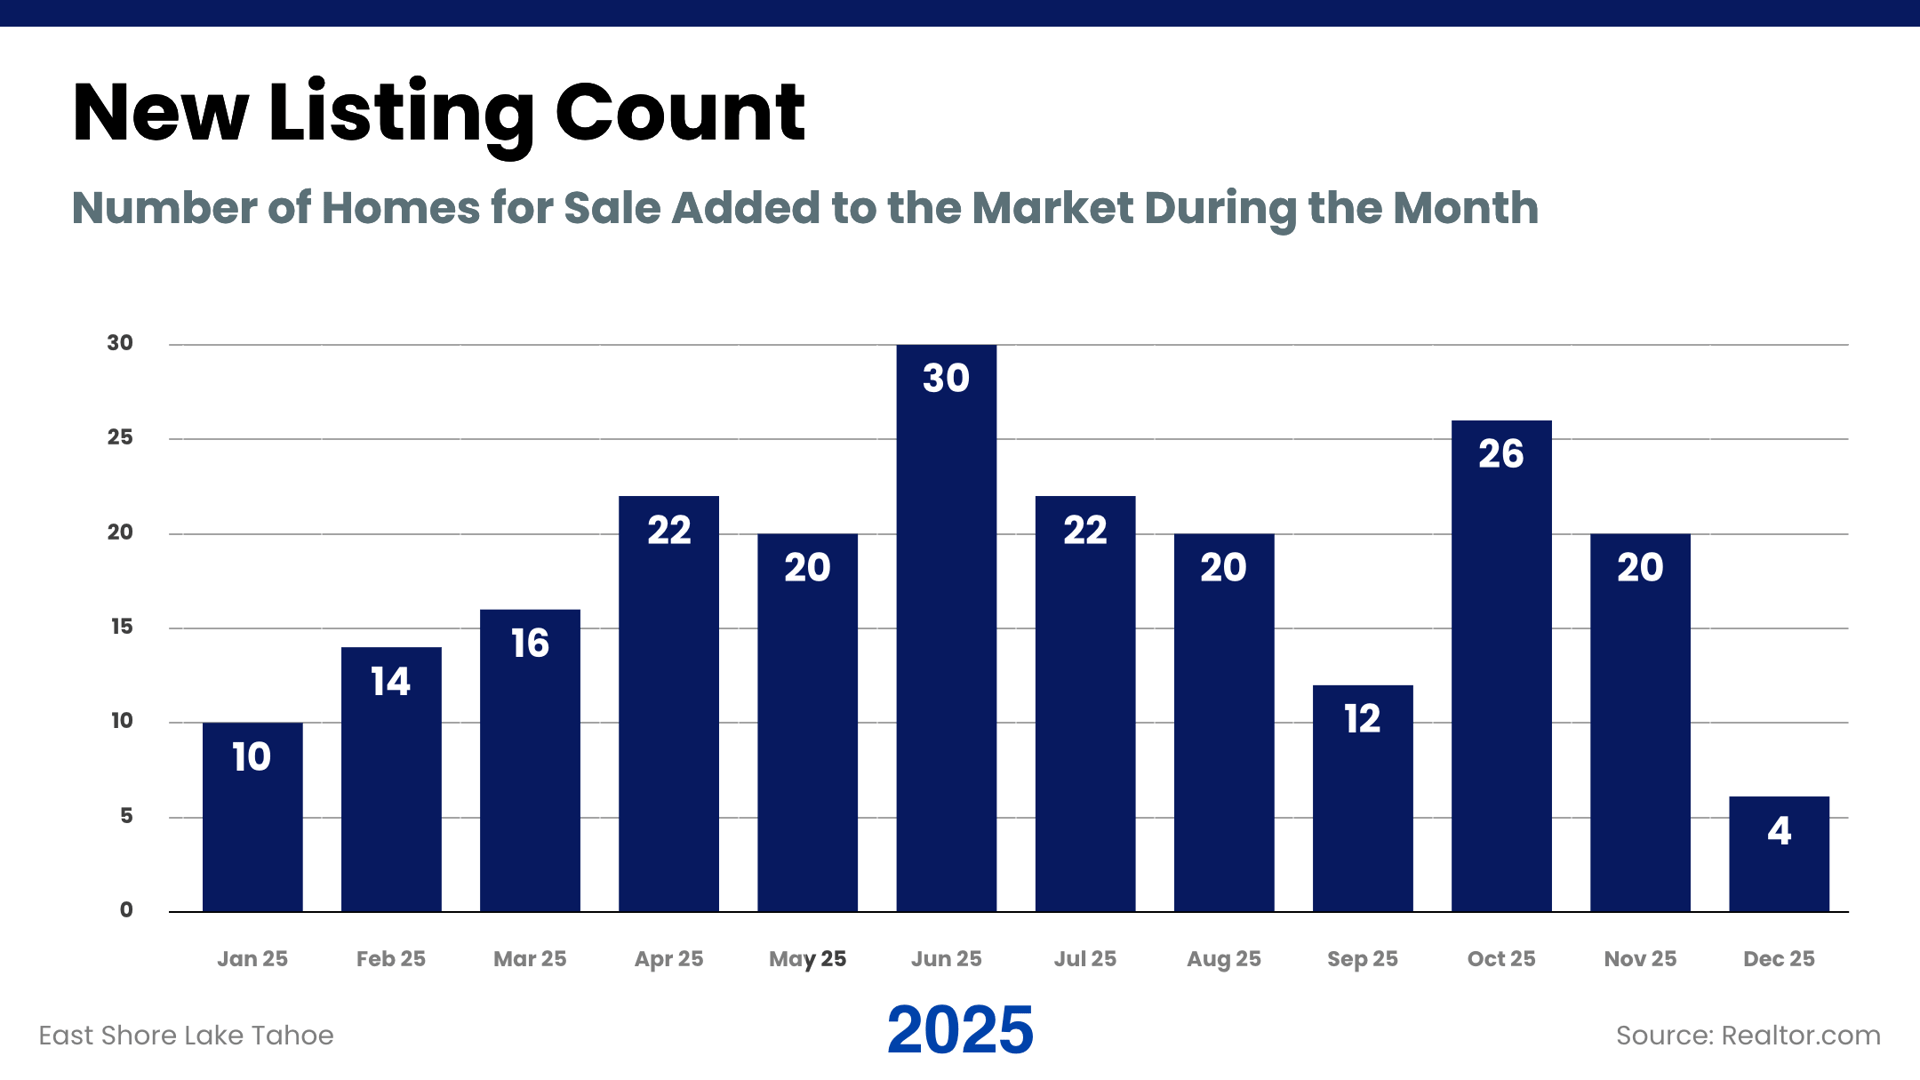
New listings followed the typical seasonal rhythm in both years, building into late spring and early summer before tapering toward winter. In 2025, however, new supply layered on top of existing inventory more consistently, contributing to the higher active and total counts seen mid-year.
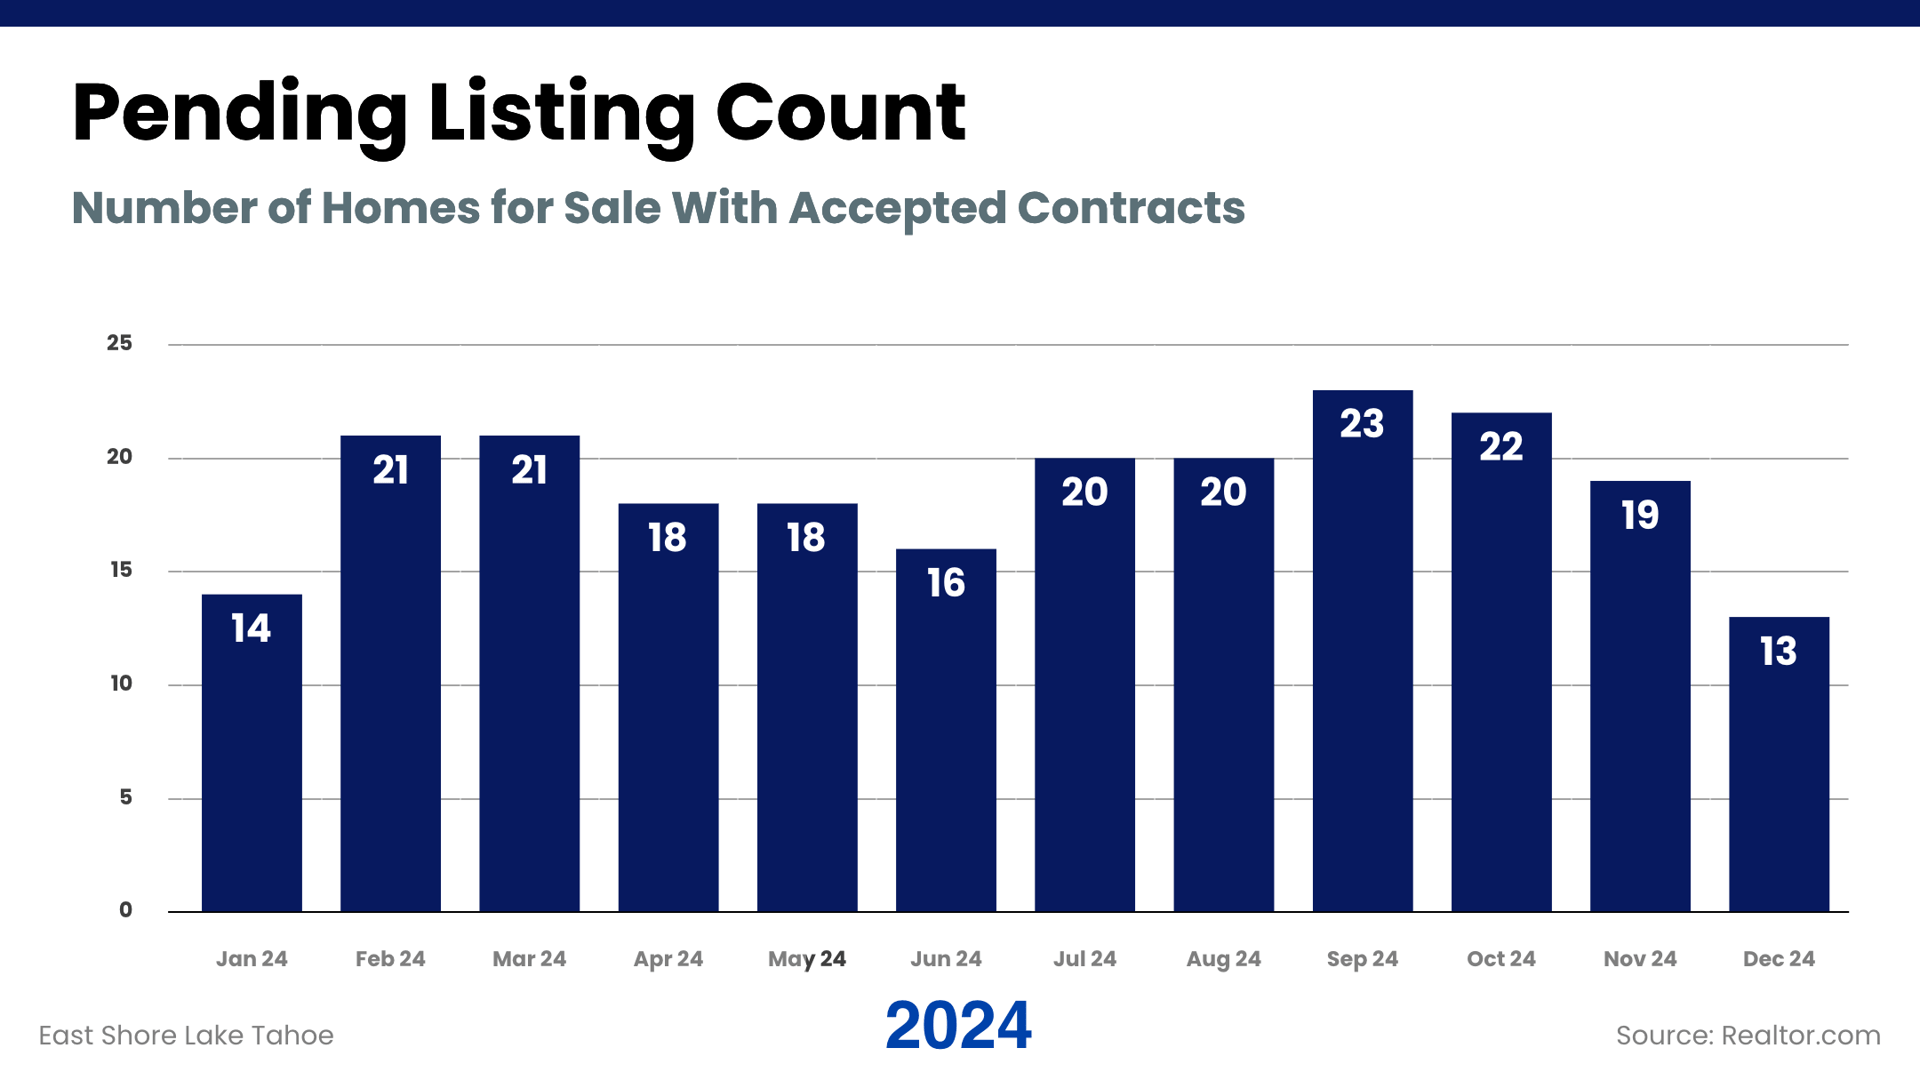
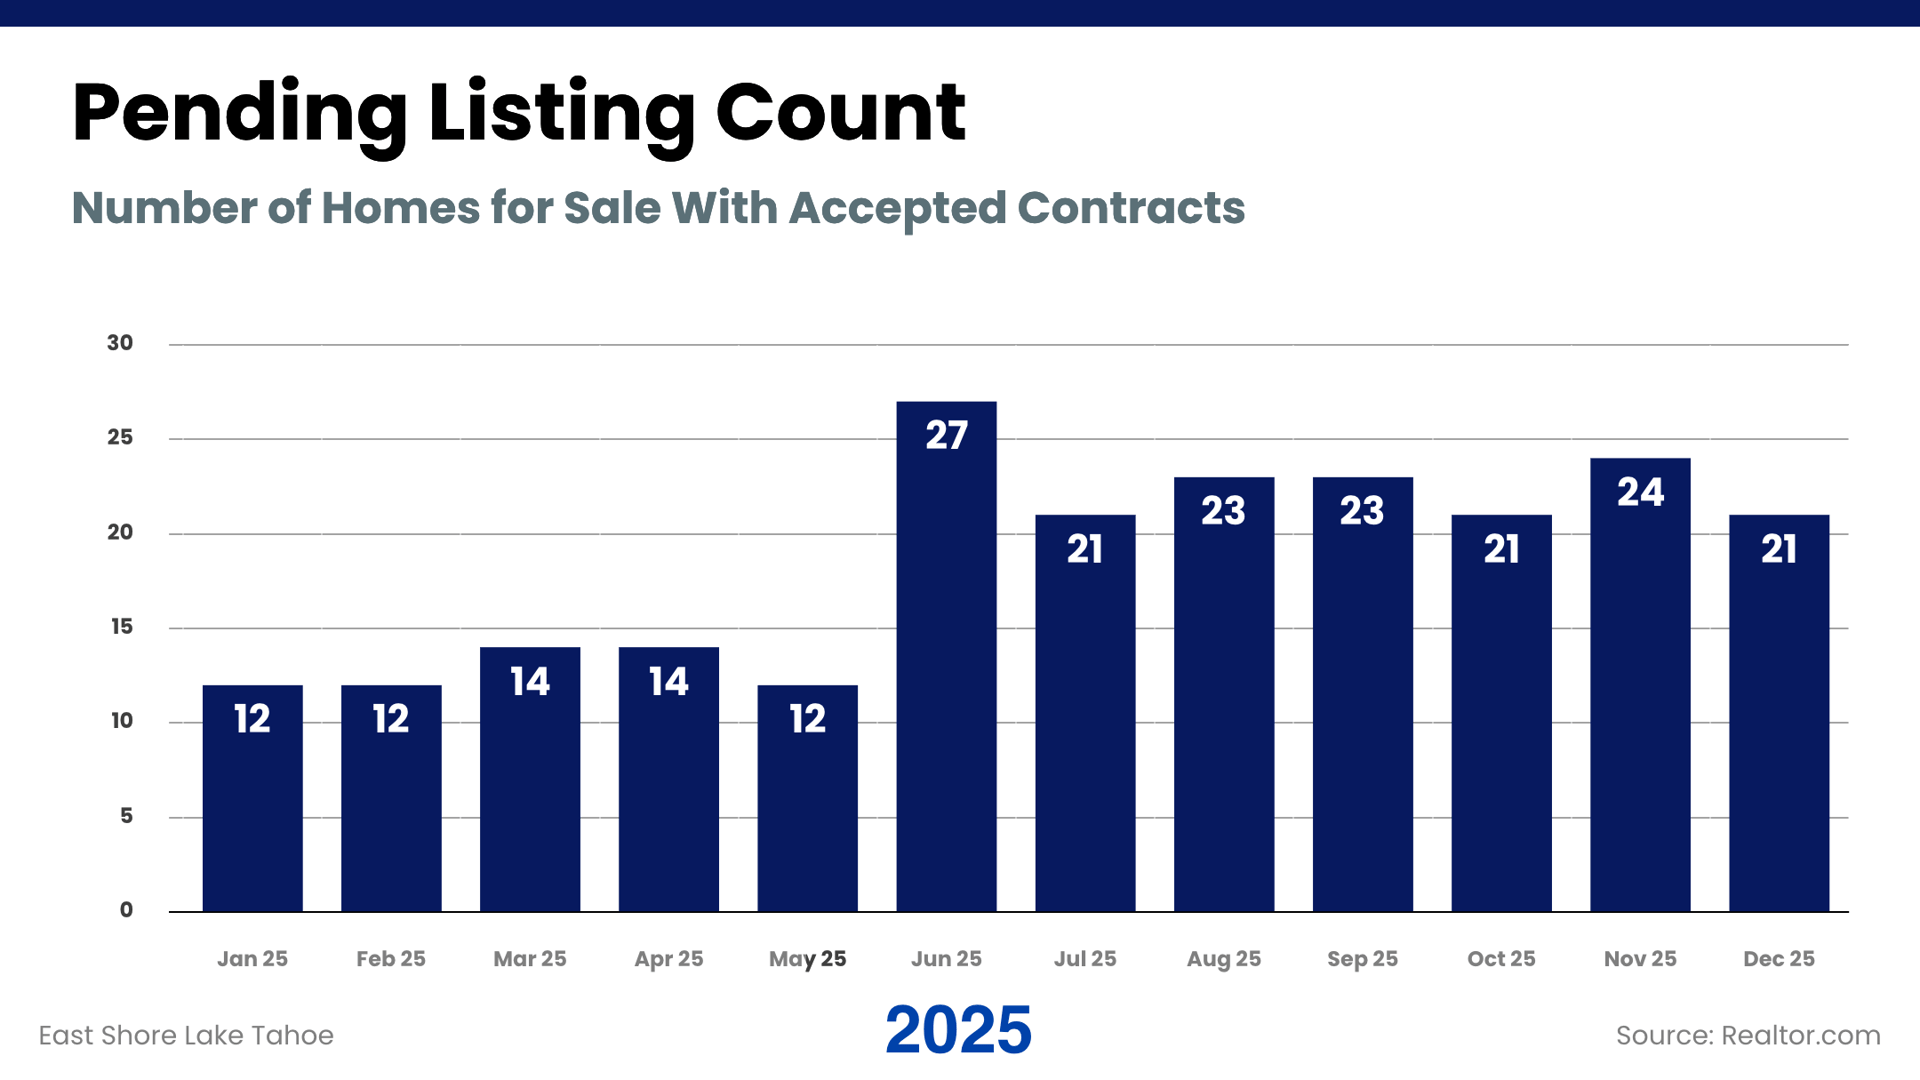
Pending activity remained steady across both years, but 2025 showed a more measured pace. Homes continued to go under contract, though absorption stretched over longer timelines. Instead of sharp surges, contract activity unfolded more evenly across the year.
This steadier cadence played a direct role in shaping months of inventory and days on market throughout the year.
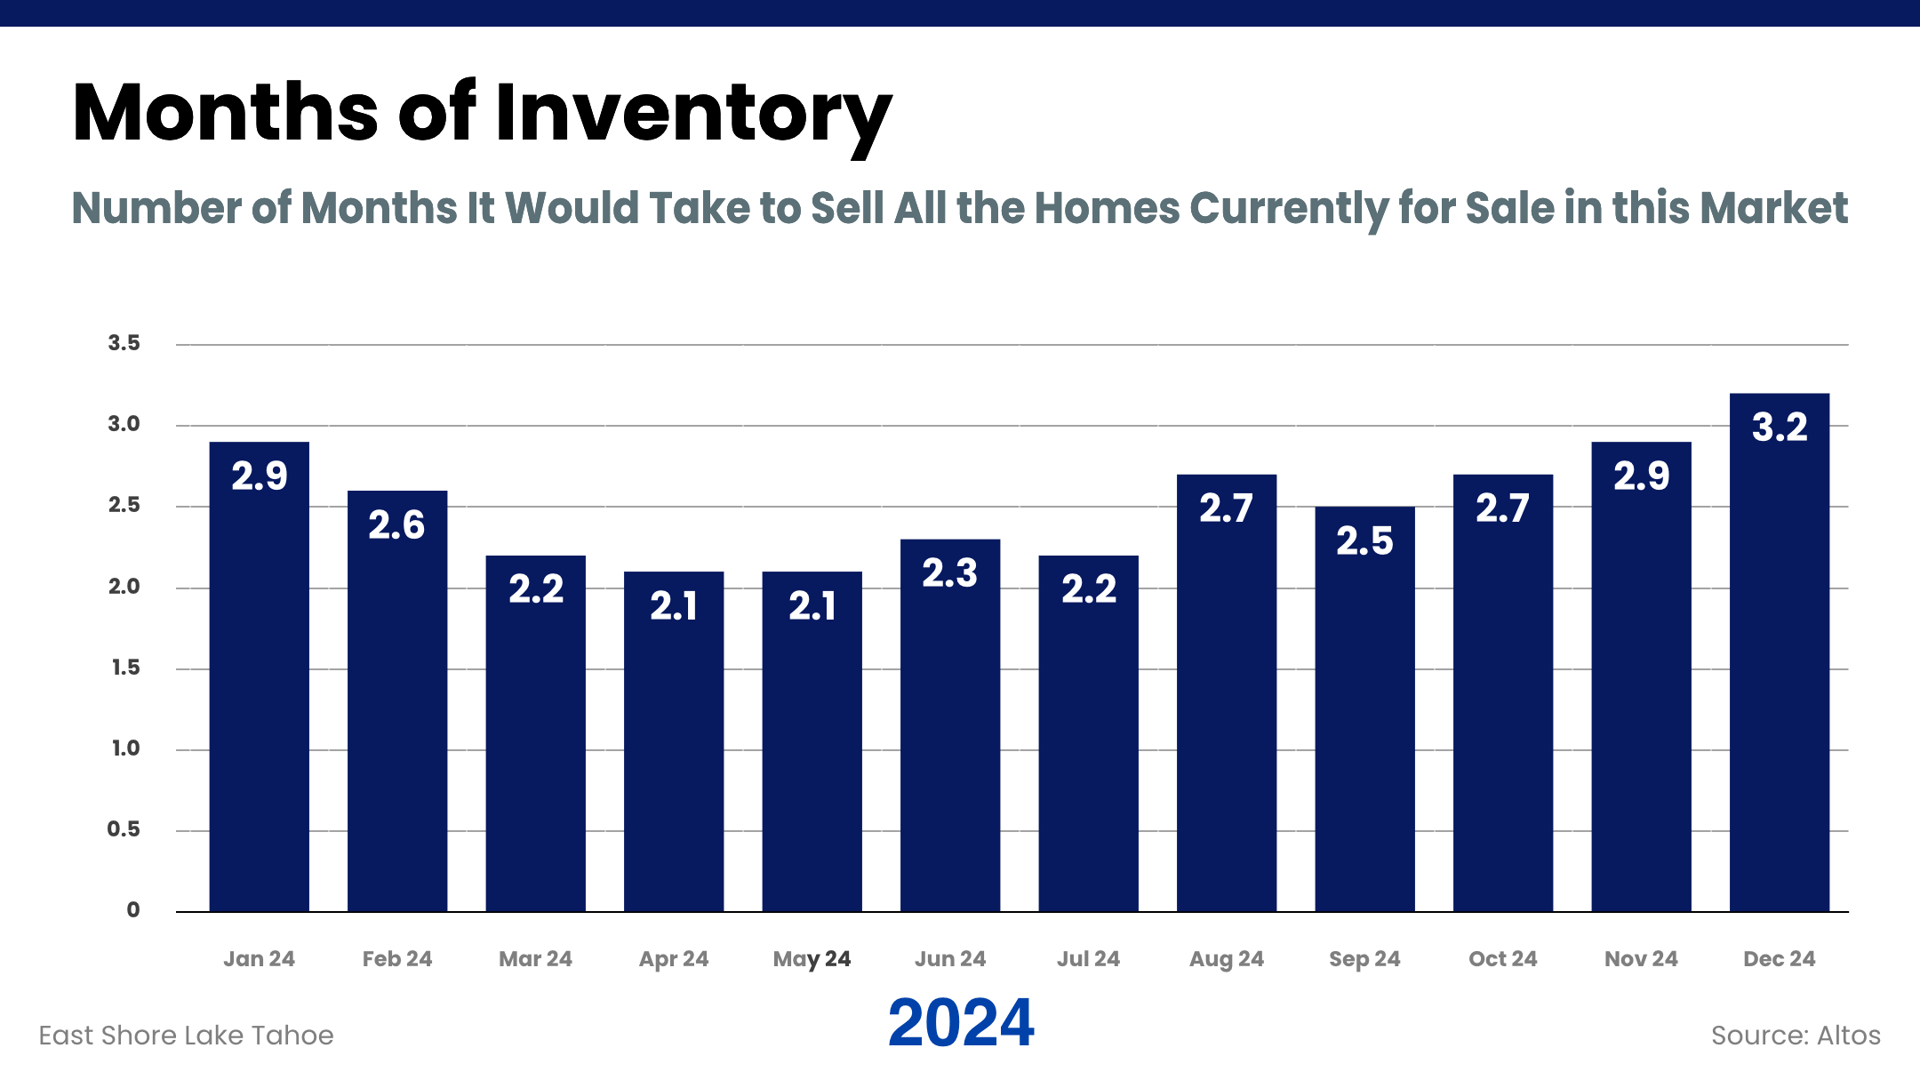
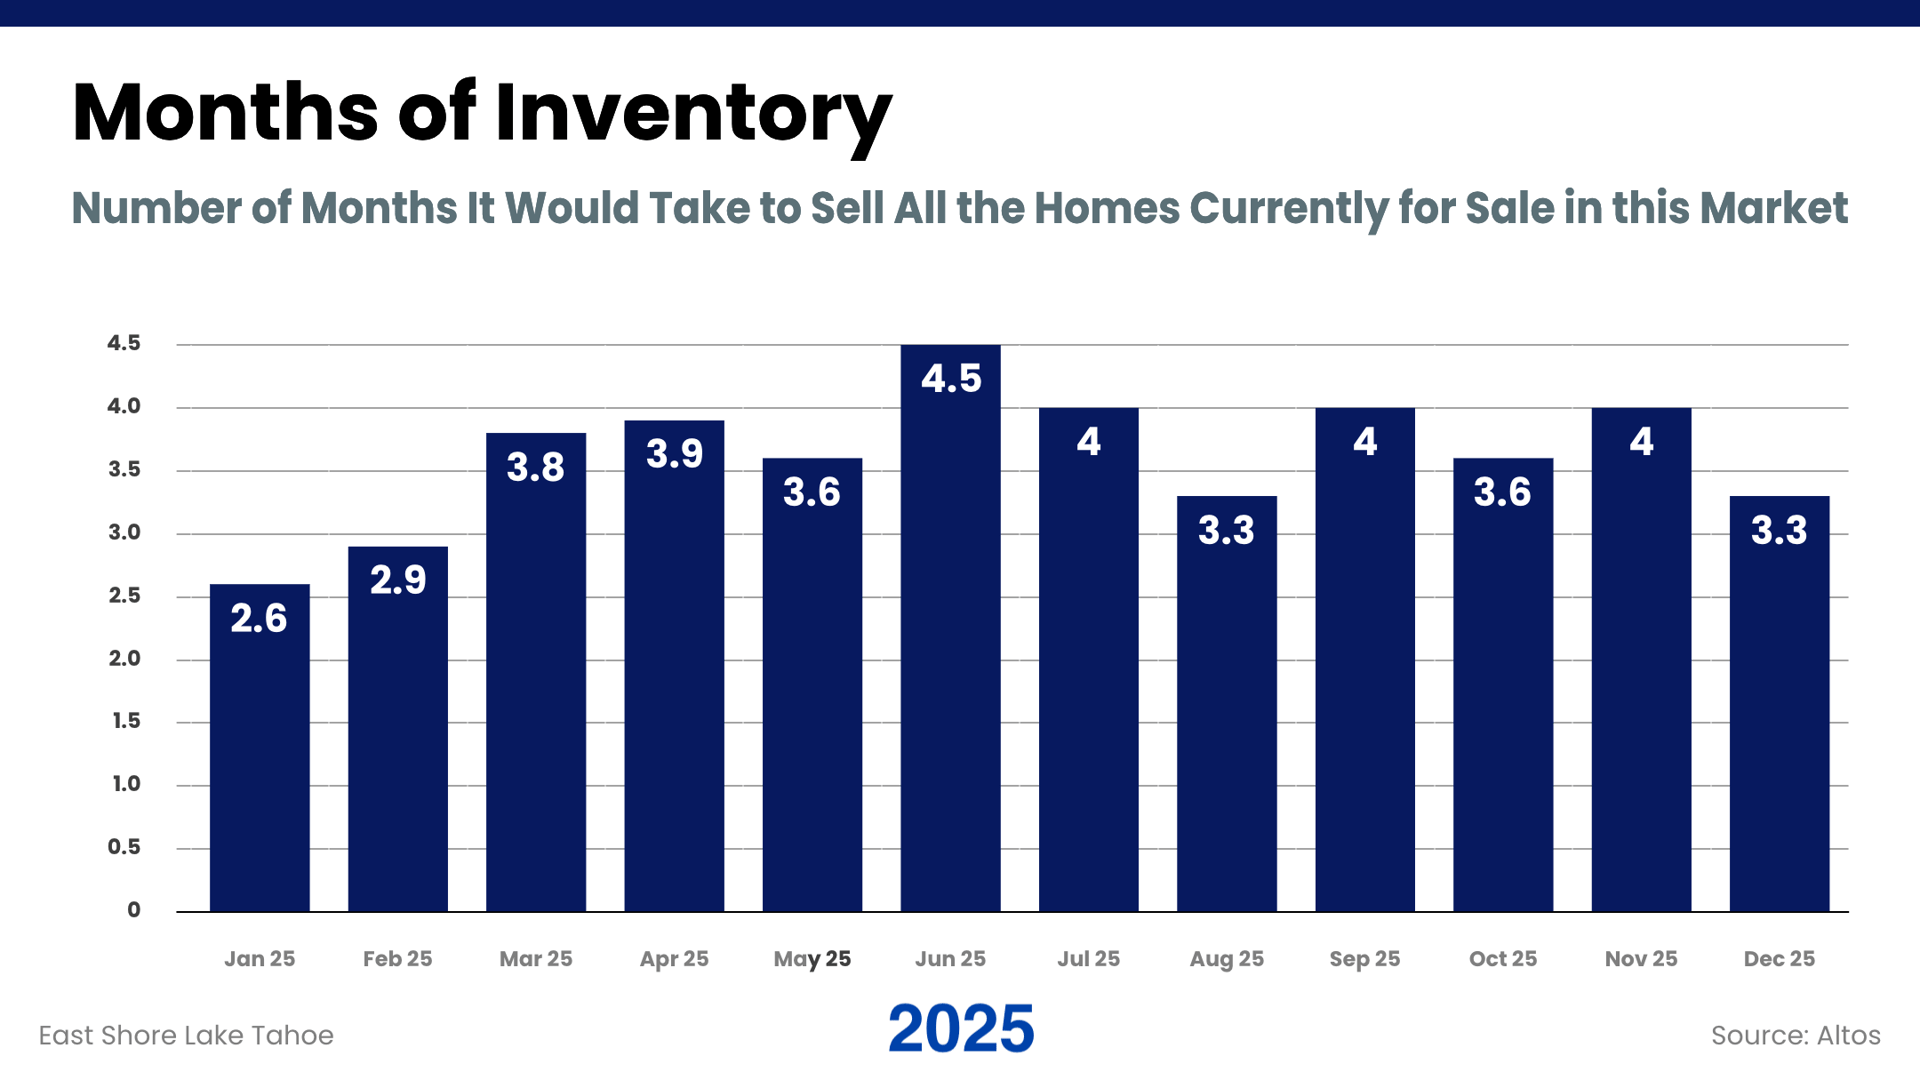
For much of 2025, months of inventory sat higher than in 2024, especially during the peak selling months. In practical terms, homes had more company while on the market, and buyers had the ability to compare options rather than move quickly on the first available listing. As the year shifted into fall and winter, inventory levels tightened back toward those seen the year before.
Overall, 2025 functioned as a year where patience and positioning mattered more than speed, and outcomes varied depending on how a property stacked up against competing listings.
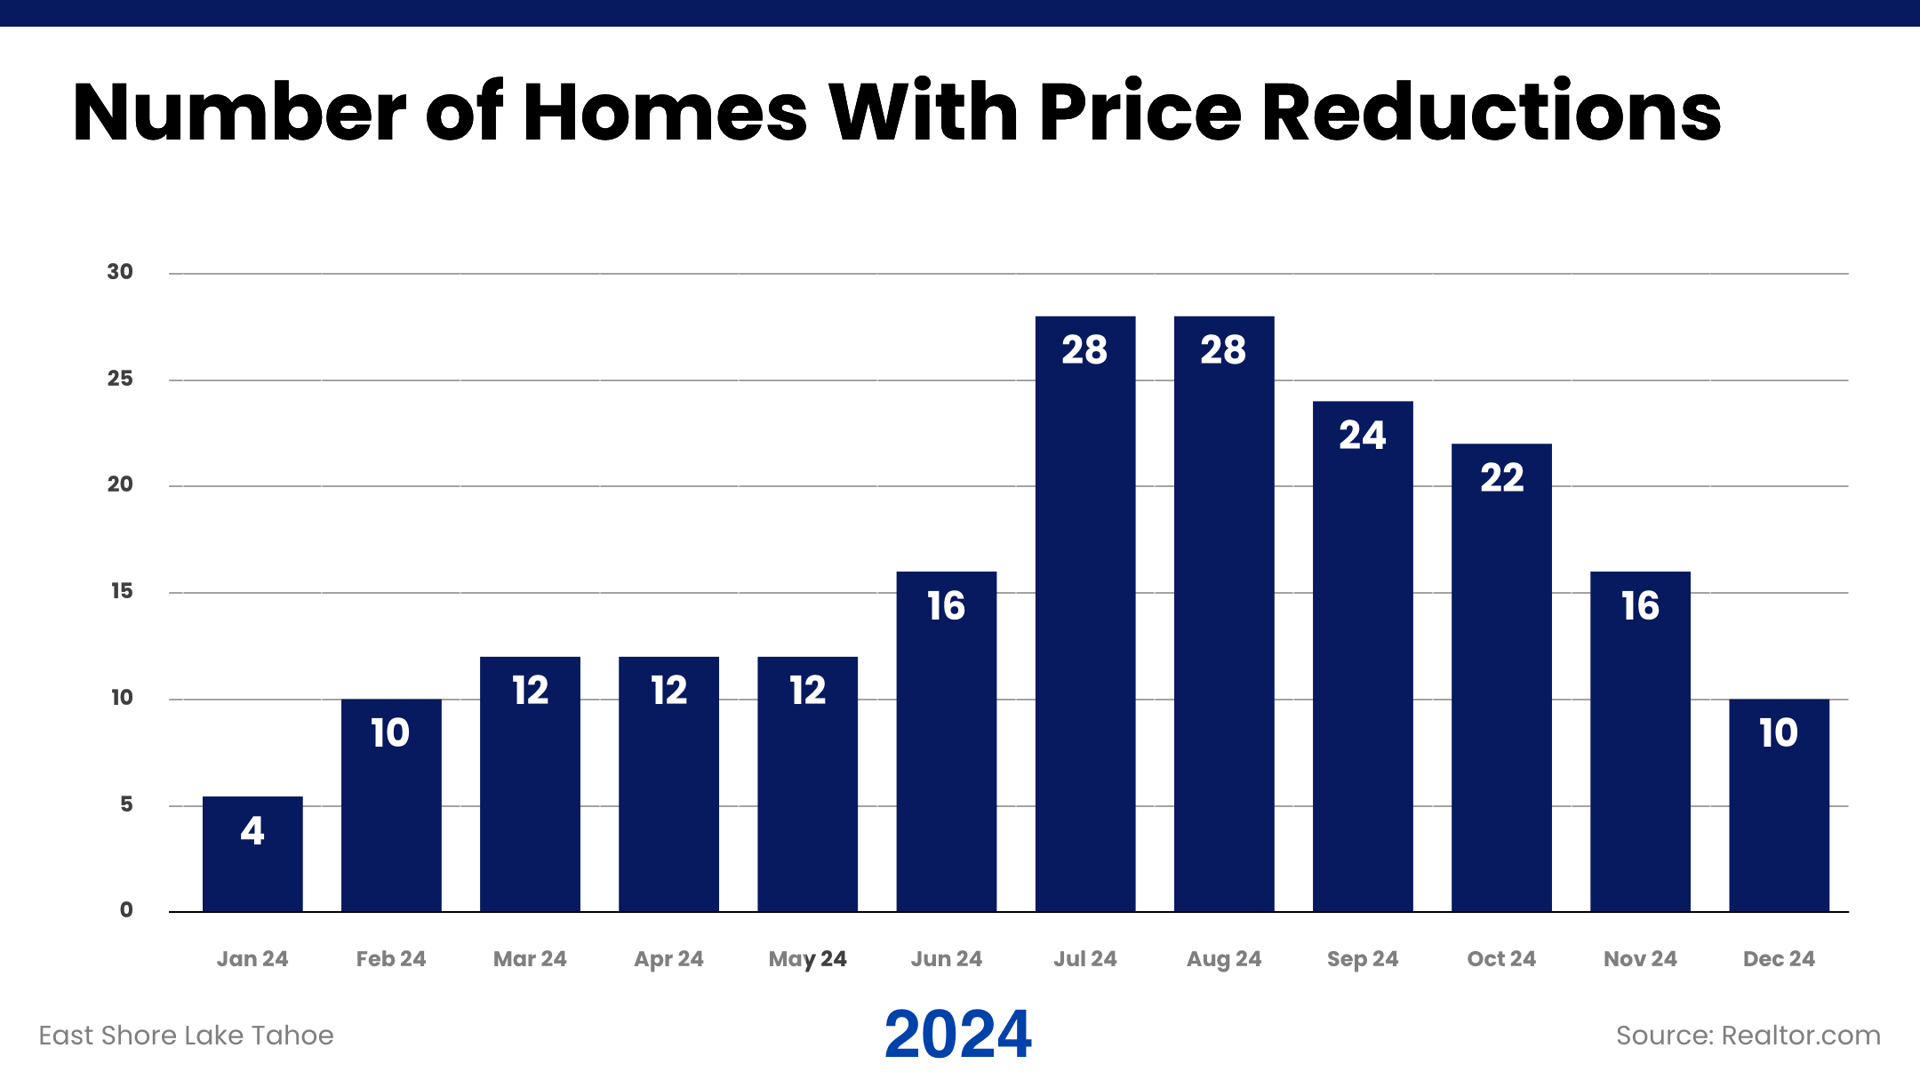
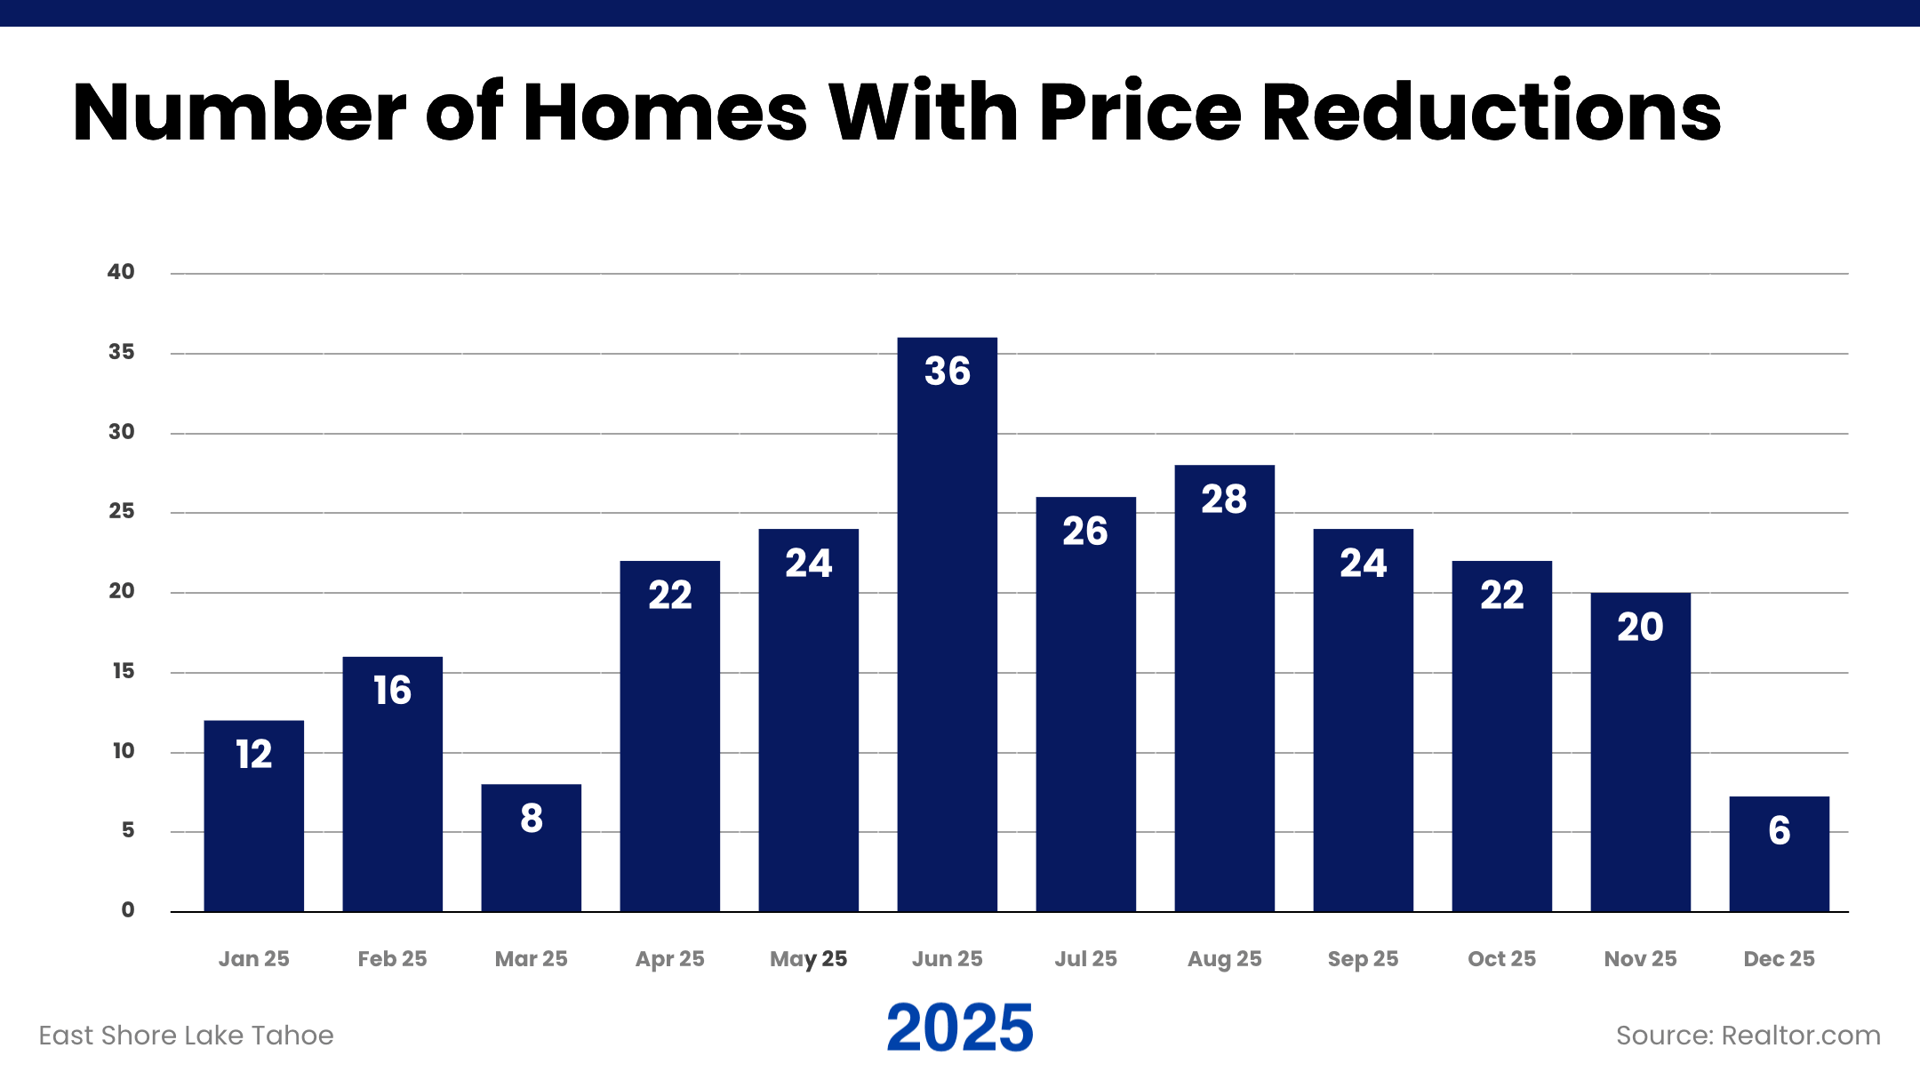
Price reductions were more prevalent during peak season in 2025, reflecting the need for mid-course corrections as buyers pushed back against aspirational pricing. As the year progressed, the frequency of reductions declined, leaving a pool of listings that were more closely aligned with market expectations.
Over the course of the year, pricing adjusted toward levels buyers were willing to engage with.
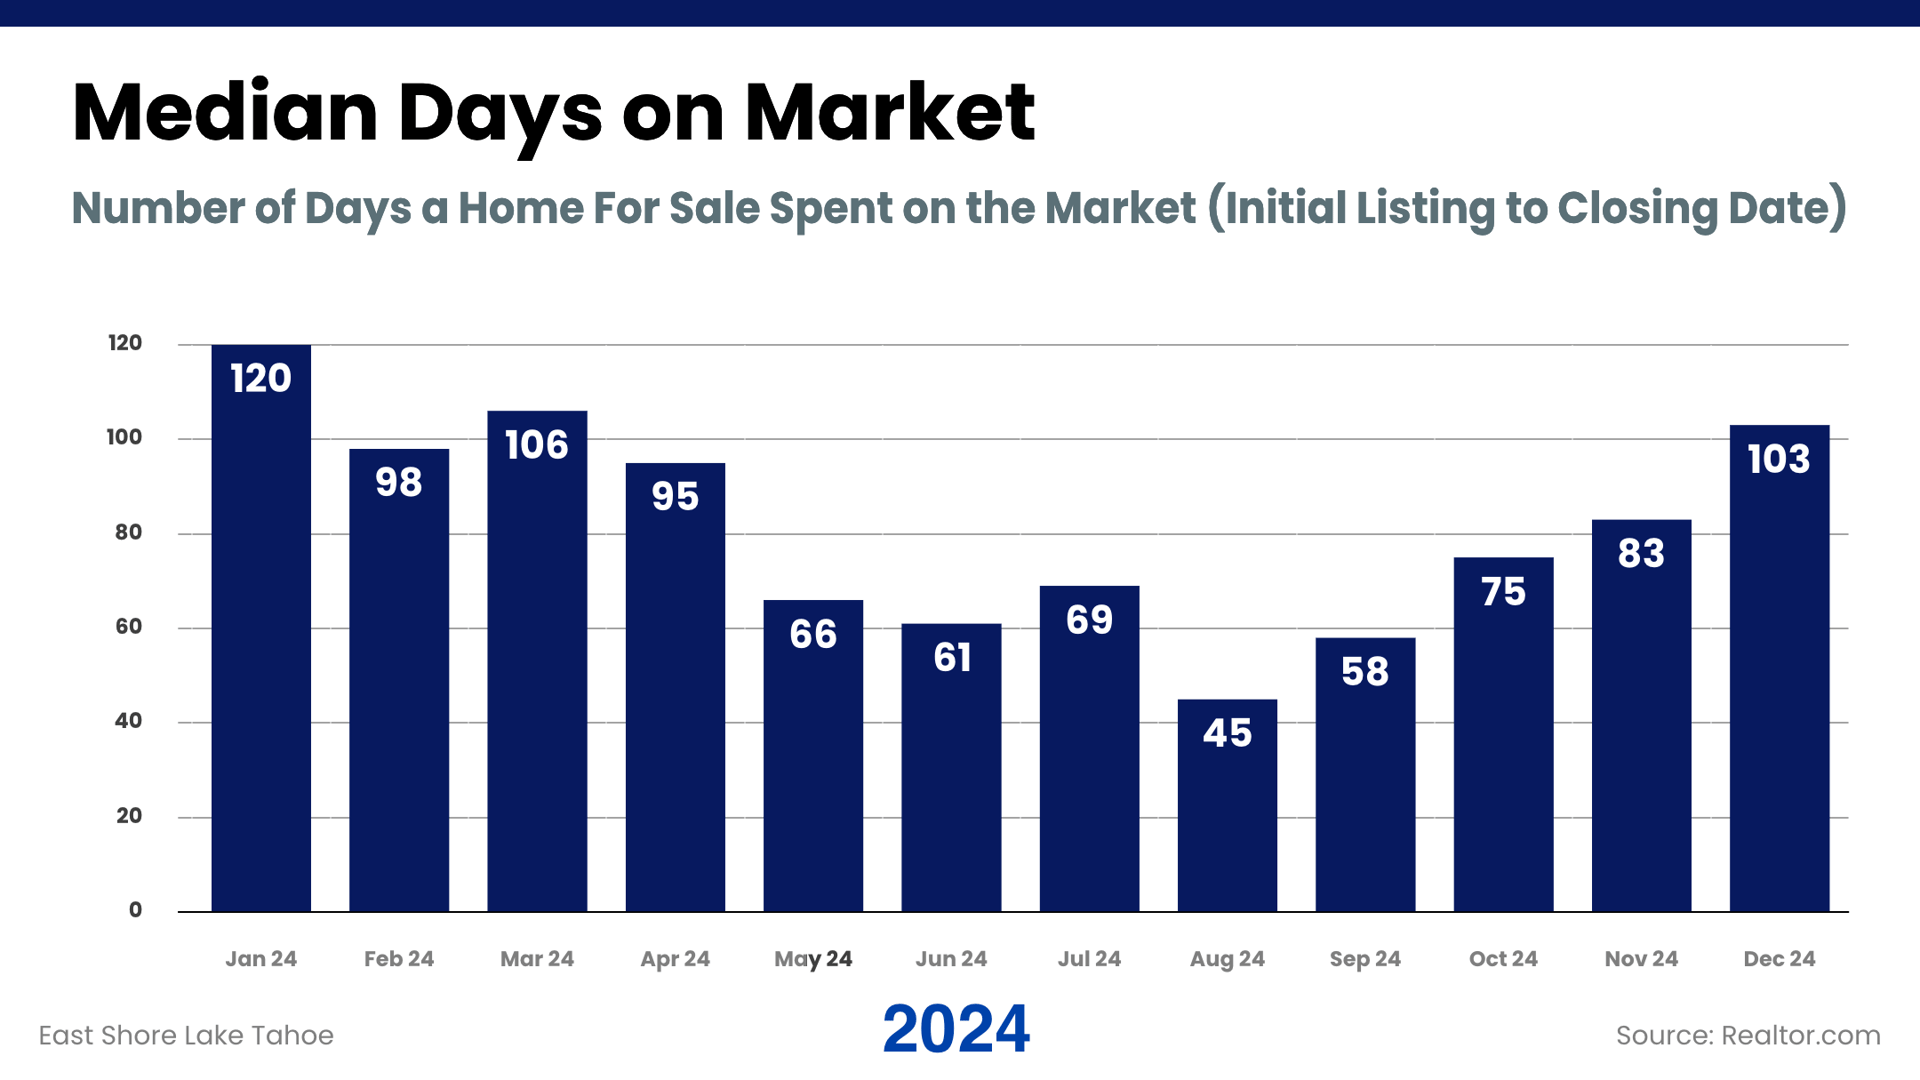
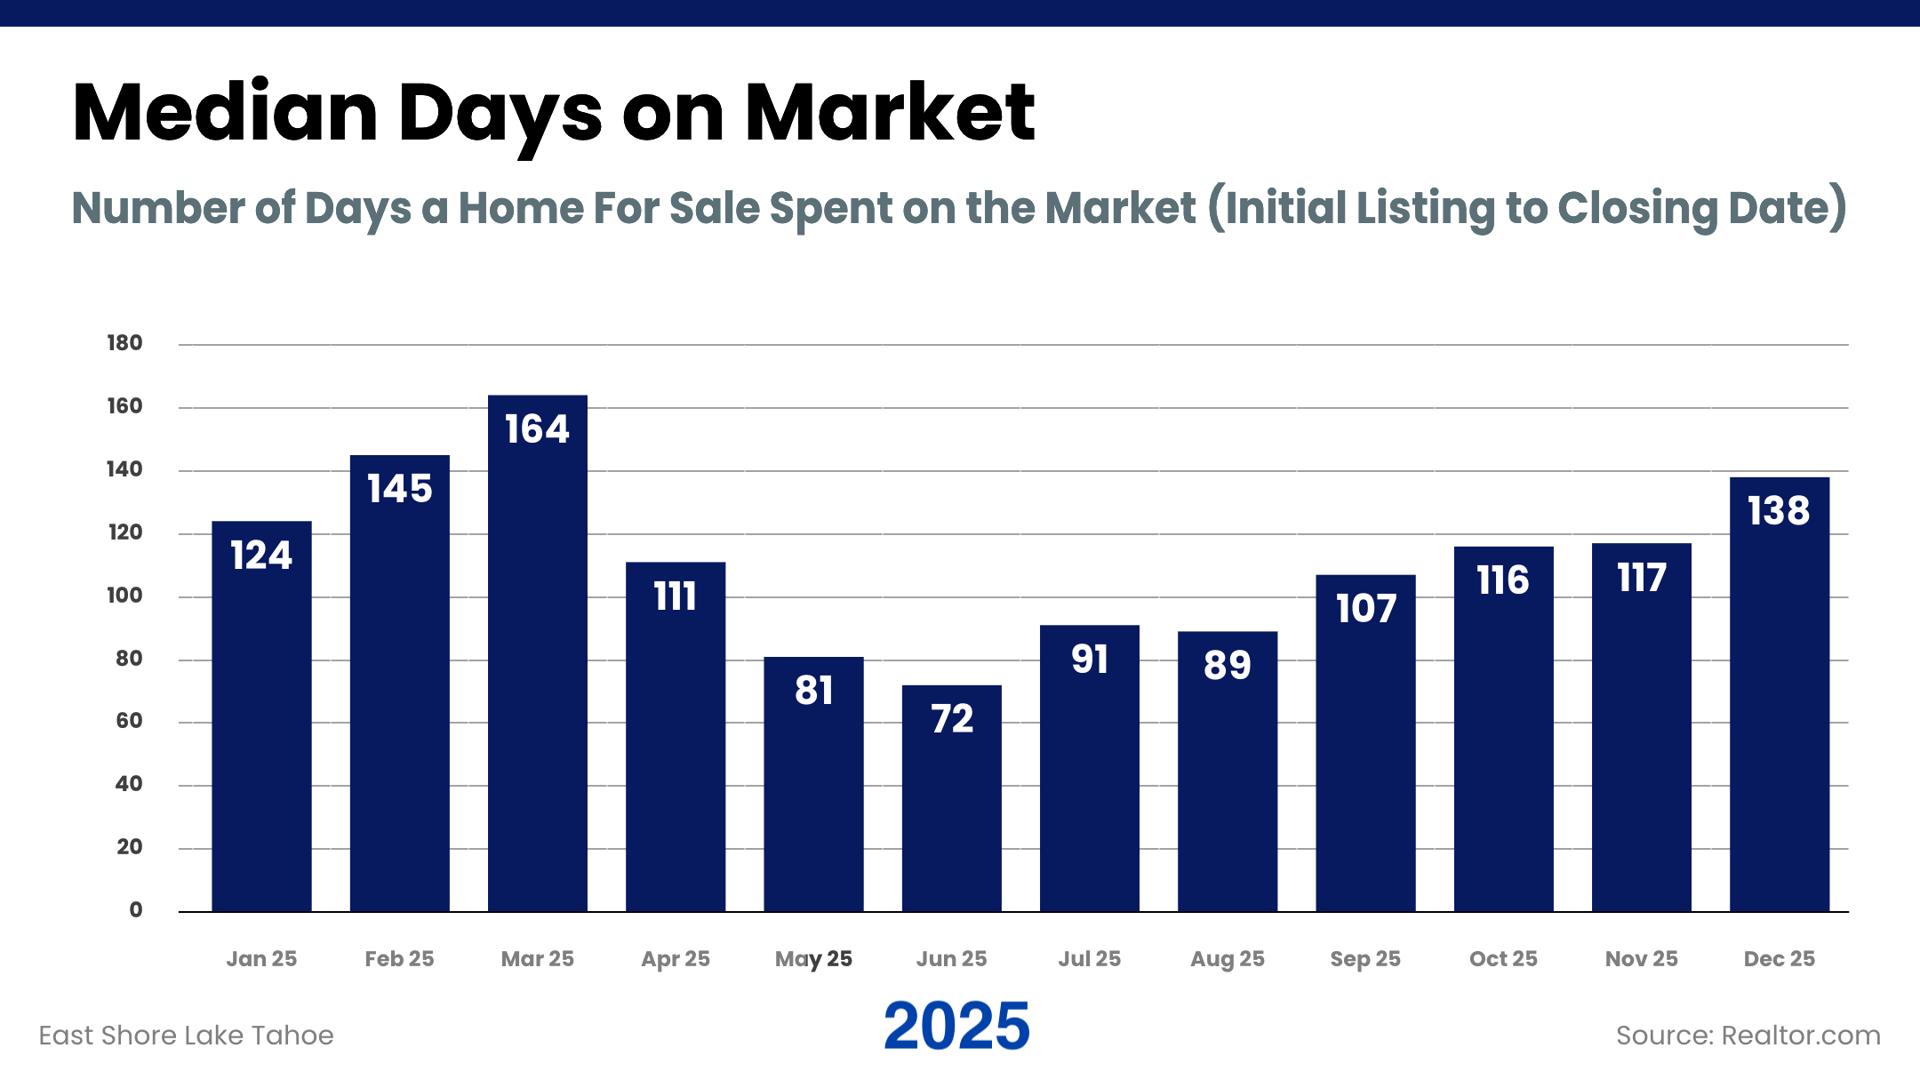
Homes generally spent more time on the market in 2025 than in 2024. Longer exposure meant listings were visible to multiple waves of buyers rather than selling quickly after launch. Sales continued to occur, but properties that entered the market well-prepared and accurately priced were better positioned to convert attention into offers.
This contrasted with parts of 2024, when homes were more likely to sell shortly after hitting the market.
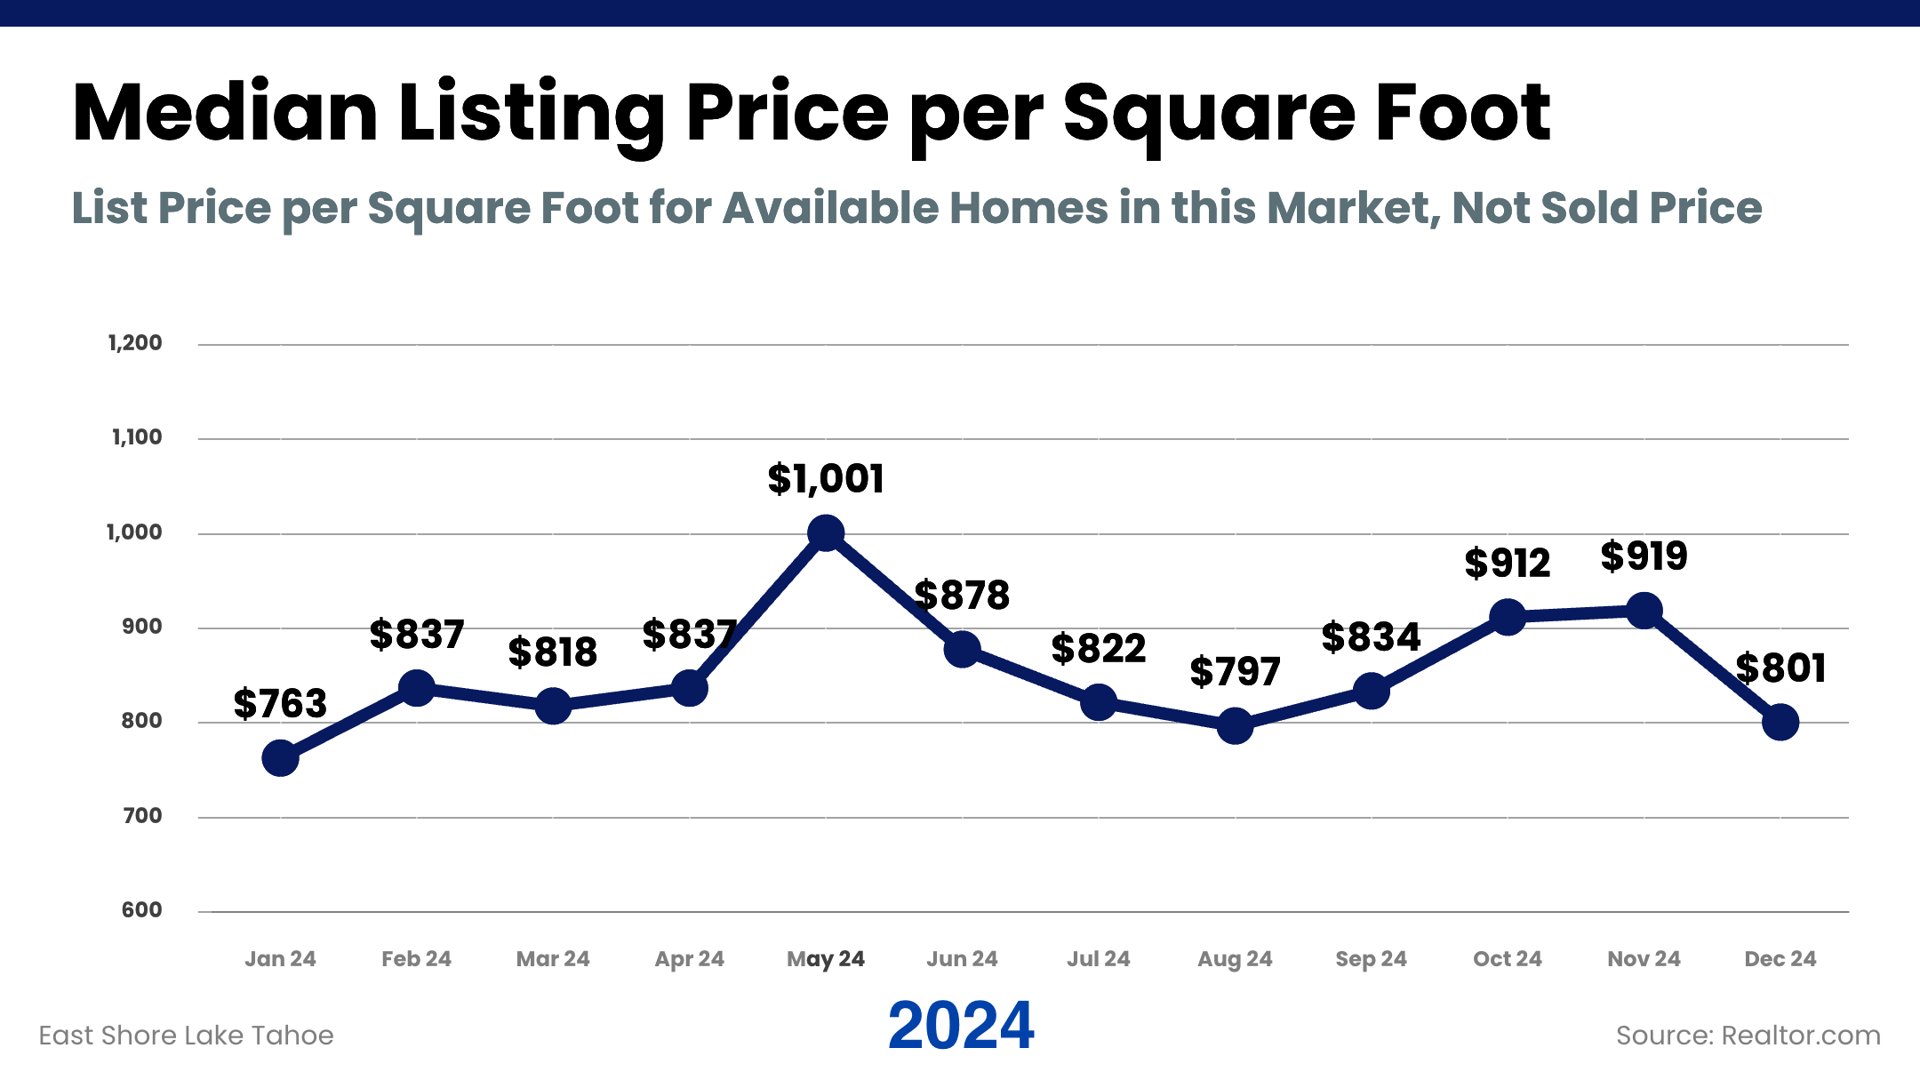
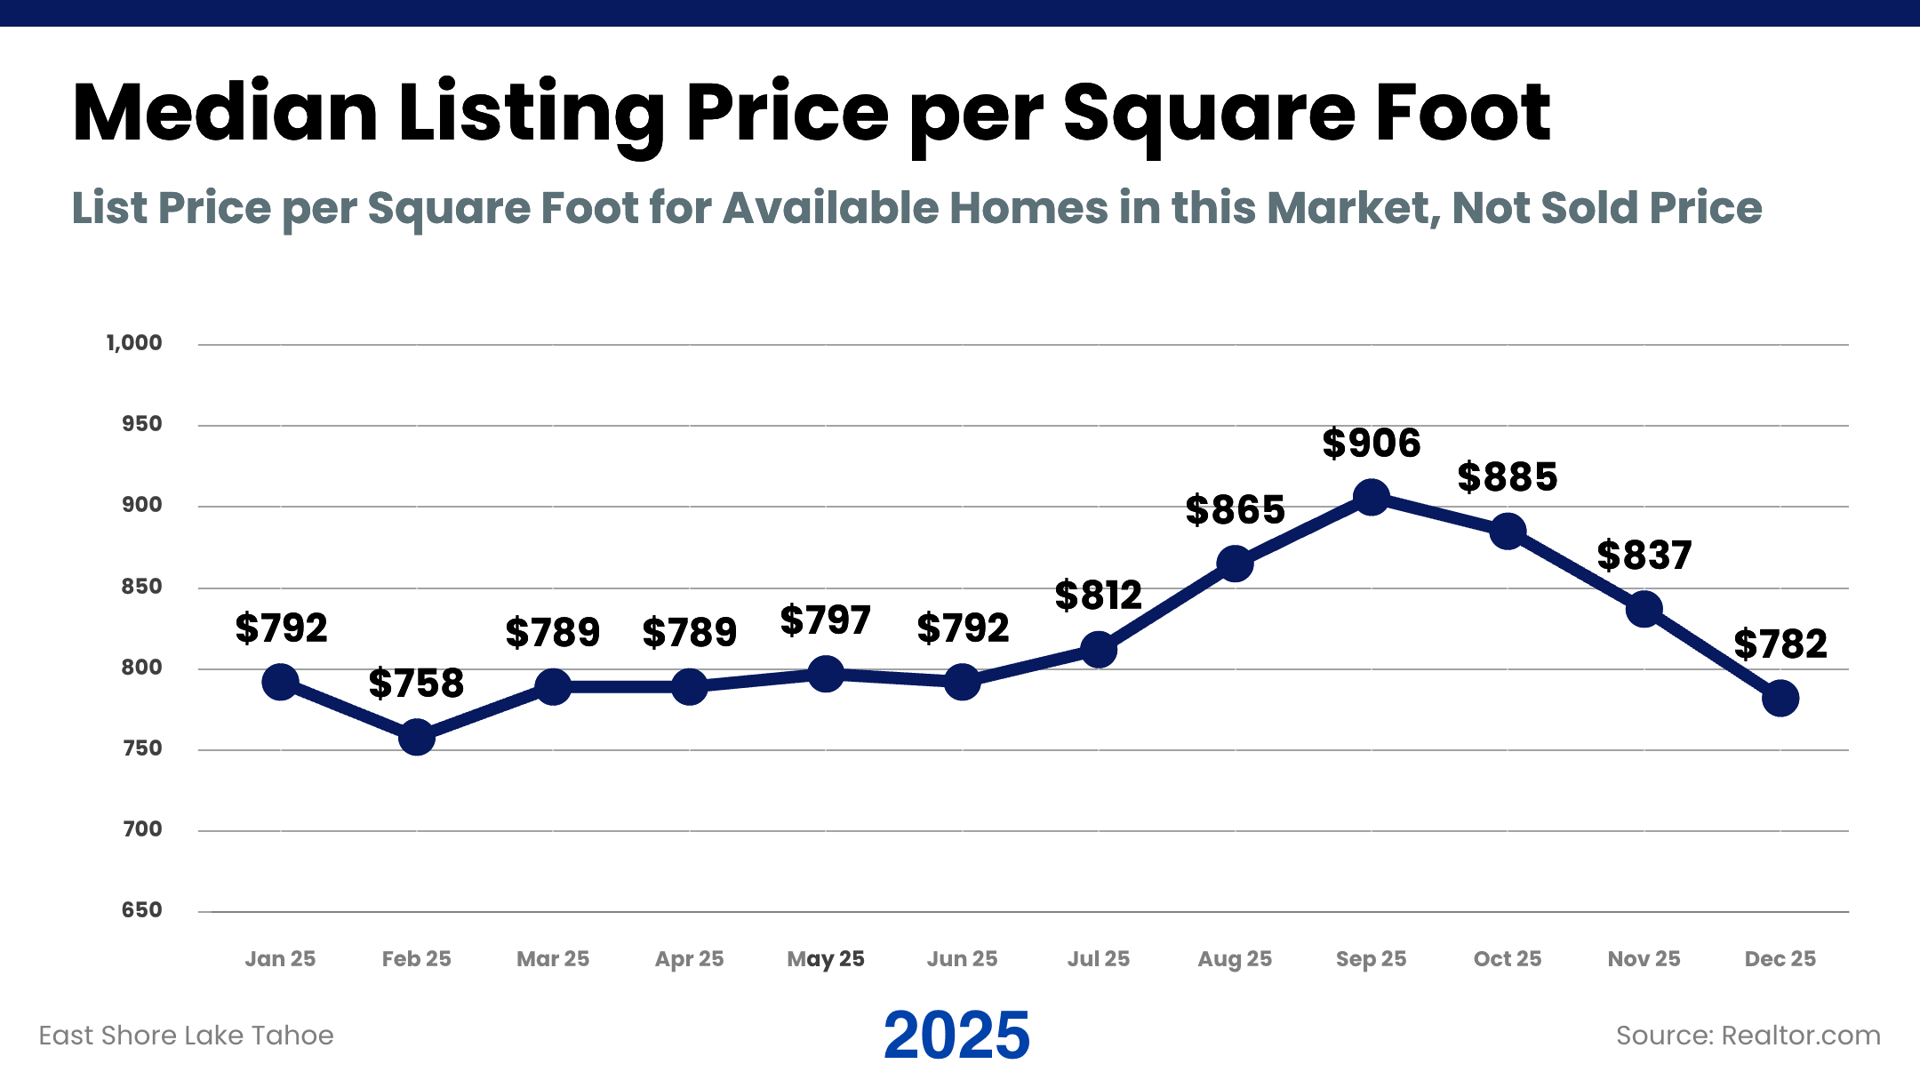
List price per square foot fluctuated in both years, with 2025 showing greater sensitivity to changes in inventory mix. Higher-priced listings moved through the market earlier in the year, while later months reflected a different set of available homes. As a result, changes in this metric reflected which types of homes were on the market at the time, not because prices were rising or falling across the market.
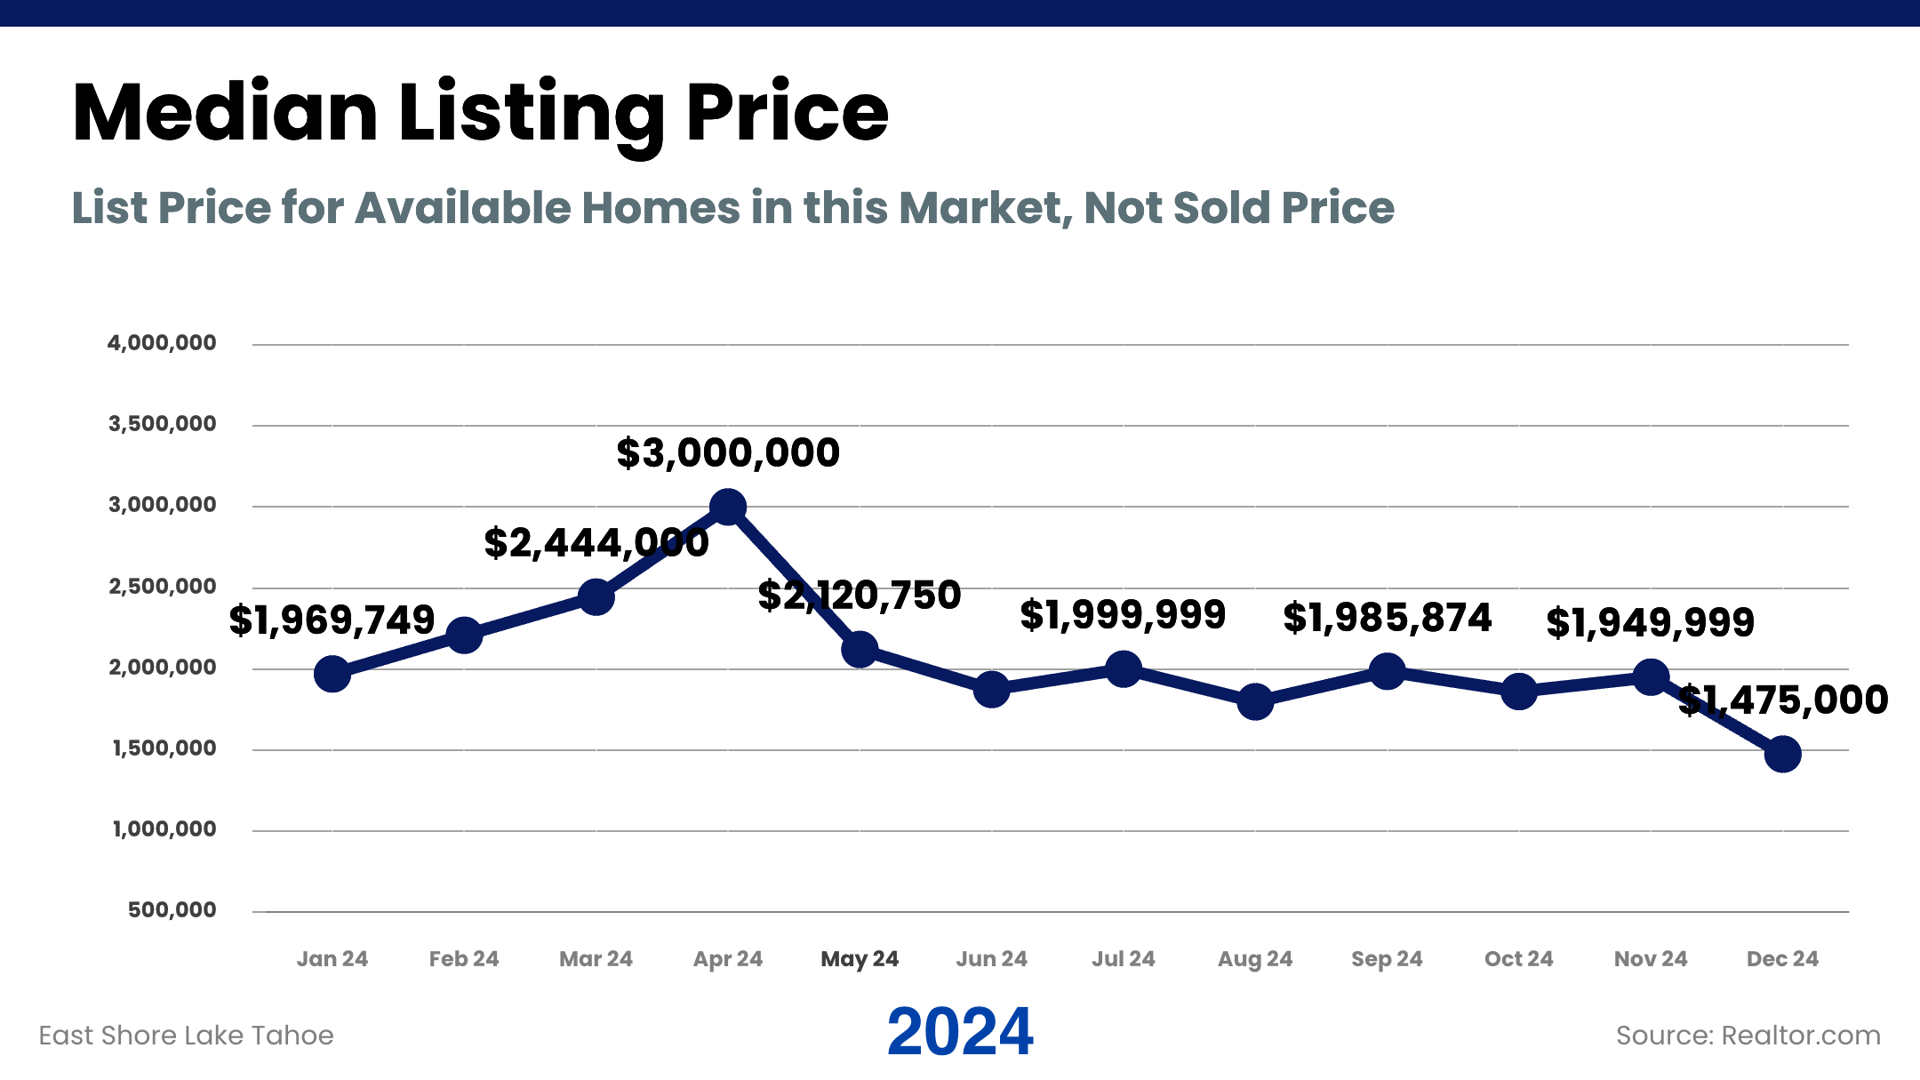
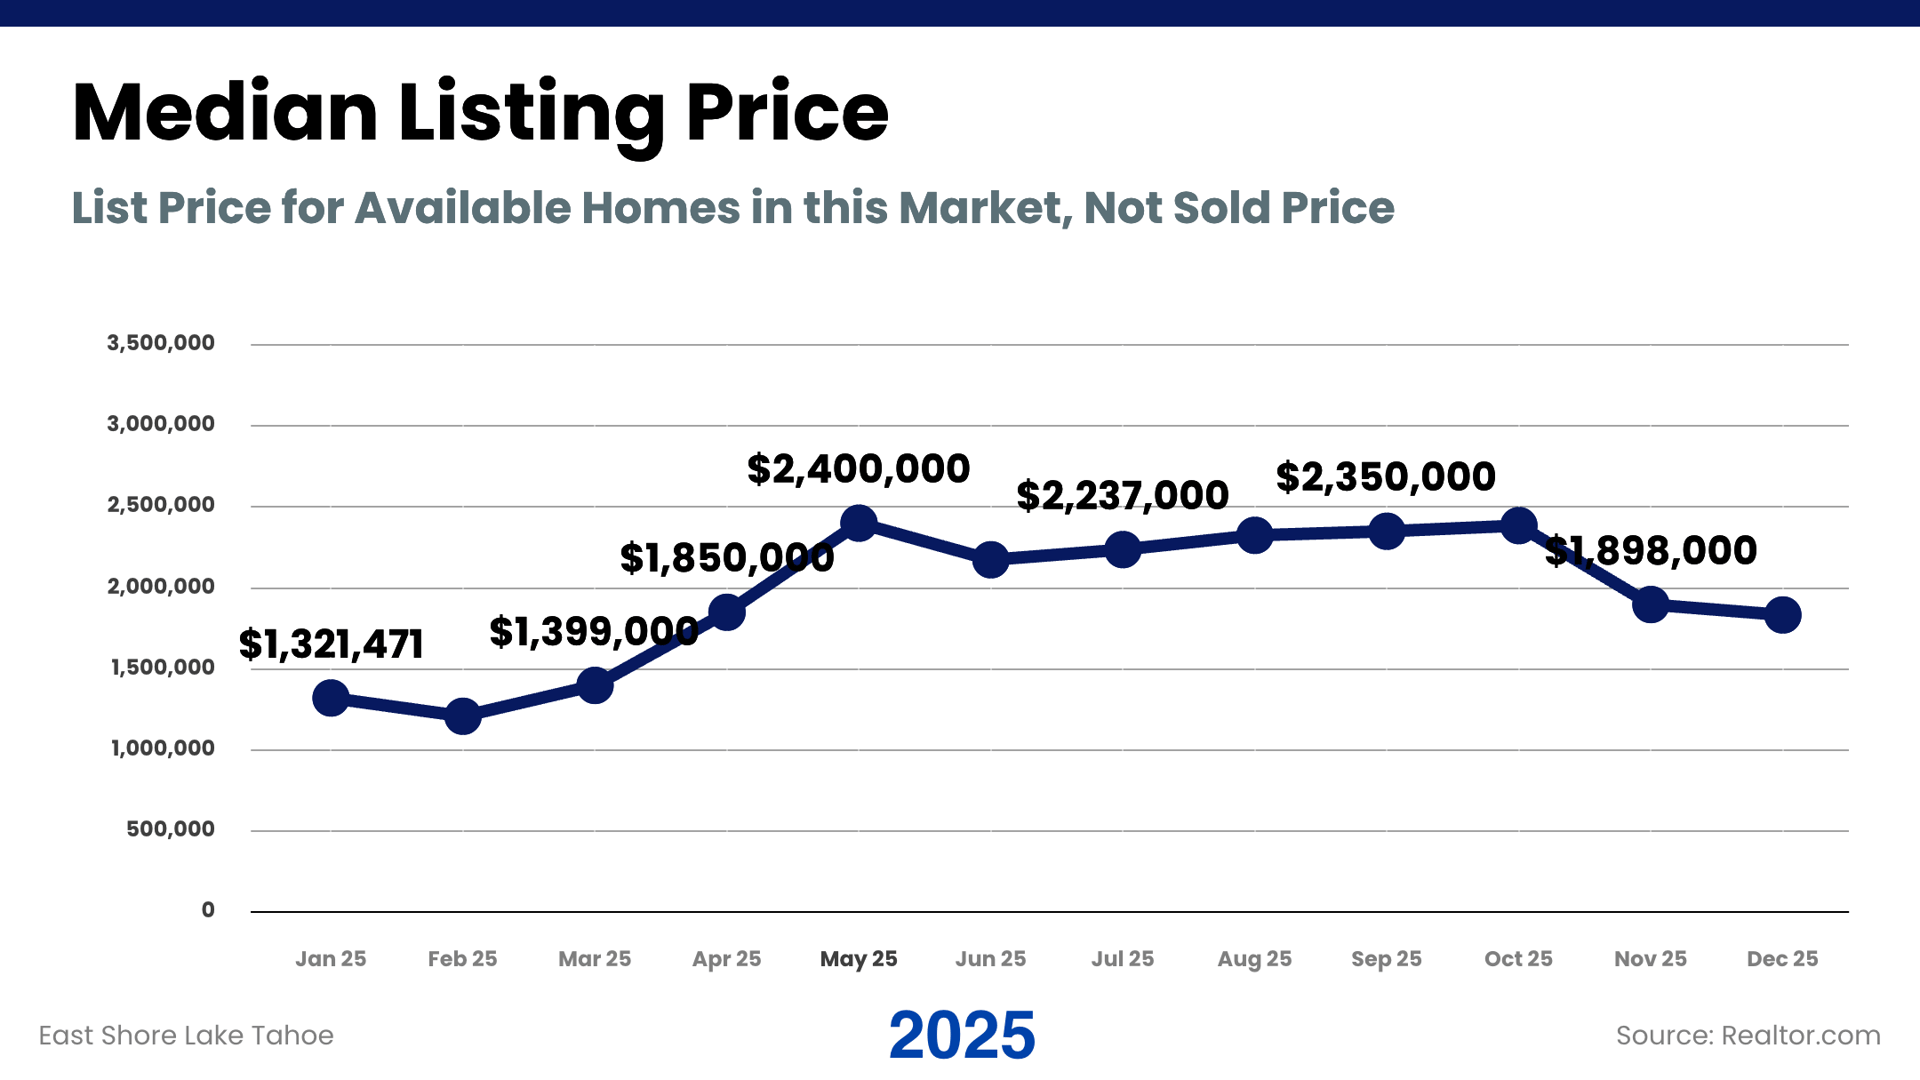
Median listing price moved over the year based on the price ranges of homes that were actively listed. On the East Shore, this statistic is particularly sensitive to a small number of very high-priced outliers. In both years, the presence or absence of higher-priced listings influenced the median. In 2025, fewer high-priced homes were listed later in the year, which lowered the year-end median without indicating a market-wide price decline. This is the reason we decided to remove Lakefronts and Tahoe Beach Club from the overall statistics this time in our quarterly newsletter.
Looking across the full year, 2025 was shaped by higher interest rates and broader political and economic uncertainty, which extended decision timelines and increased scrutiny around pricing. Buyers moved carefully, while sellers who adjusted to those conditions were still able to transact. The market spent much of the year recalibrating to higher rates and a more uncertain political and economic backdrop.
Looking ahead to 2026, most industry economists and housing analysts are projecting a more constructive environment as rate expectations stabilize and uncertainty begins to ease. While broader conditions will continue to influence activity, the outlook points toward steadier participation and improved clarity for both buyers and sellers compared to the year just completed.


Get In Touch