Taloha
Now halfway through February, January’s numbers give us a clear starting point for the year. The month reflected a leaner inventory pool, measured contract activity, and pricing influenced more by the mix of available properties than by broad market shifts. With supply tightening early in the year and winter weather now drawing renewed traffic to the basin, January provides a clean snapshot of where the East Shore stood just before this latest seasonal push.
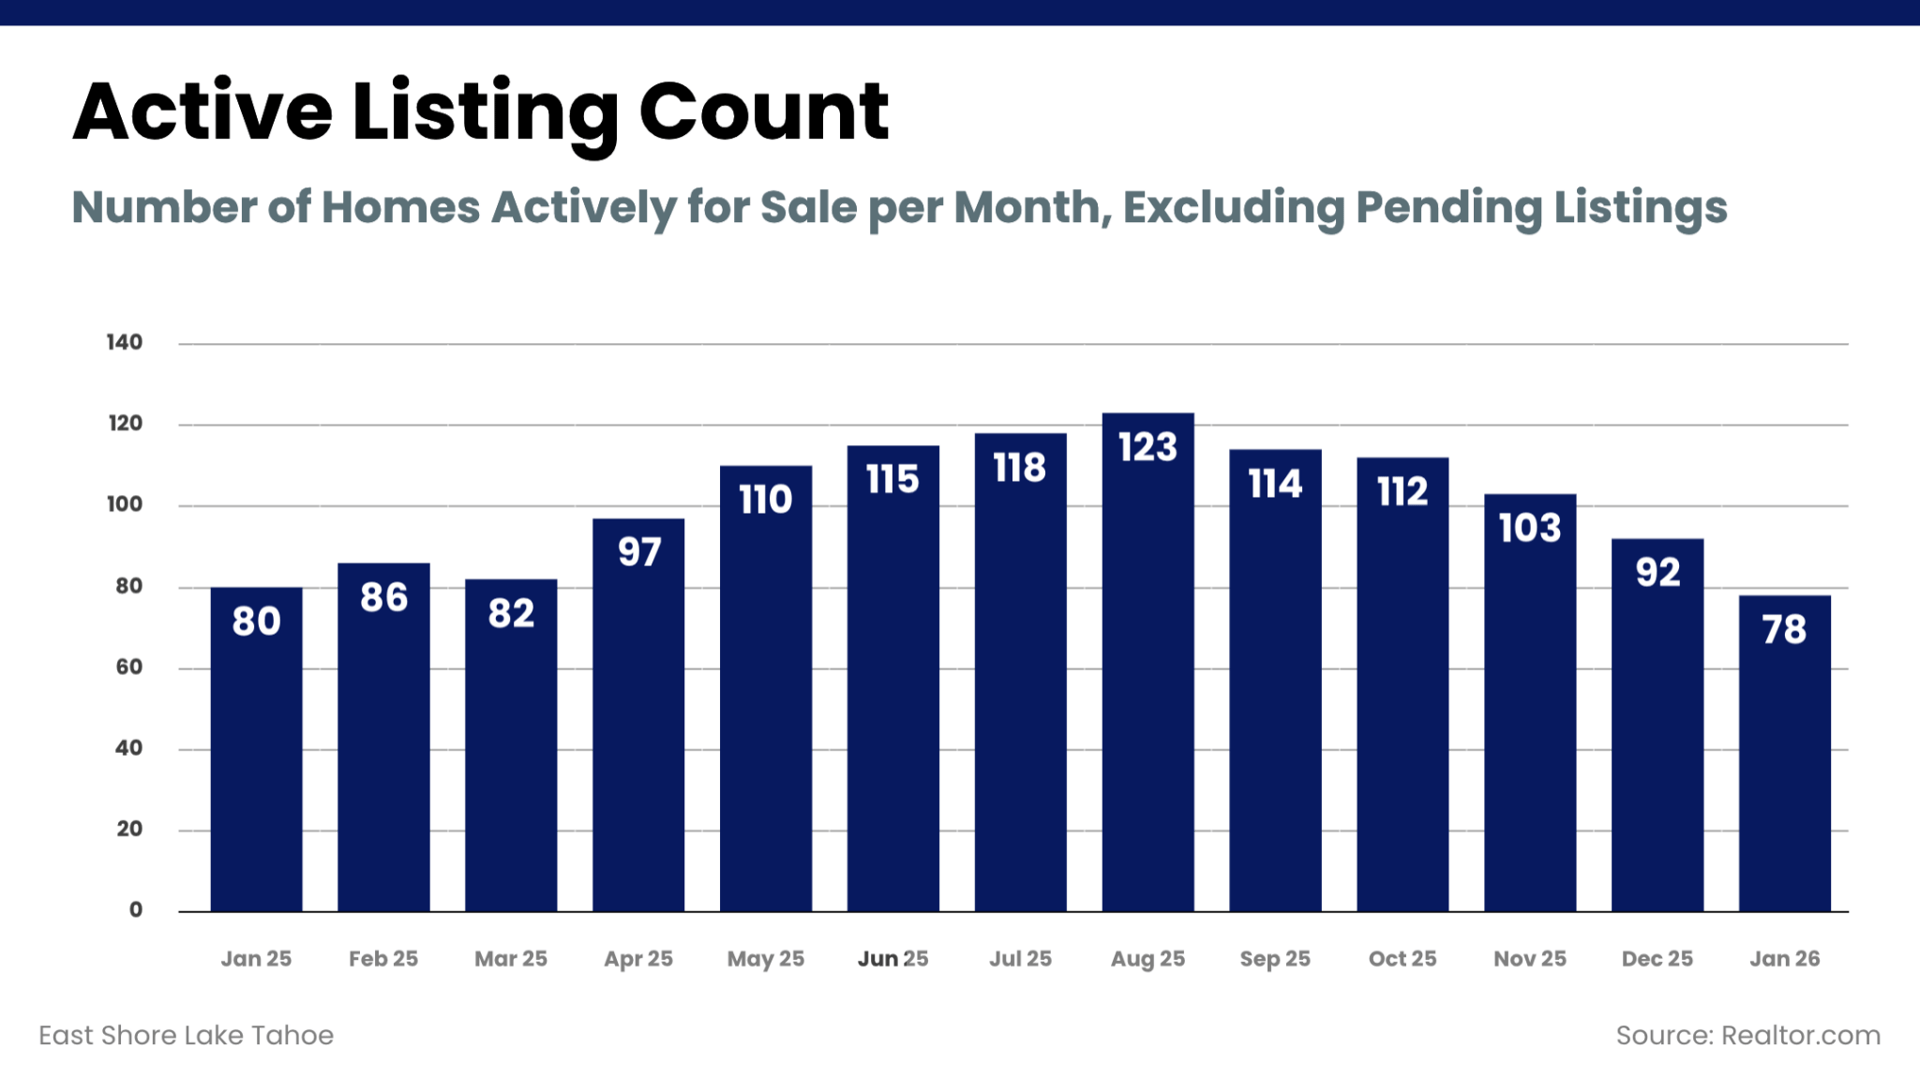
January: 78 homes (↓ from 92 in Dec ’25, ↓ from 80 in Jan ’25)
Active inventory declined again in January, falling both month over month and slightly below last year’s level. The seasonal contraction is consistent with typical early-winter patterns, as fewer sellers introduce new inventory following the holidays. Compared to one year ago, the market is operating with a slightly tighter active pool. For buyers, options narrowed modestly; for sellers, reduced competition creates clearer positioning for well-priced homes.
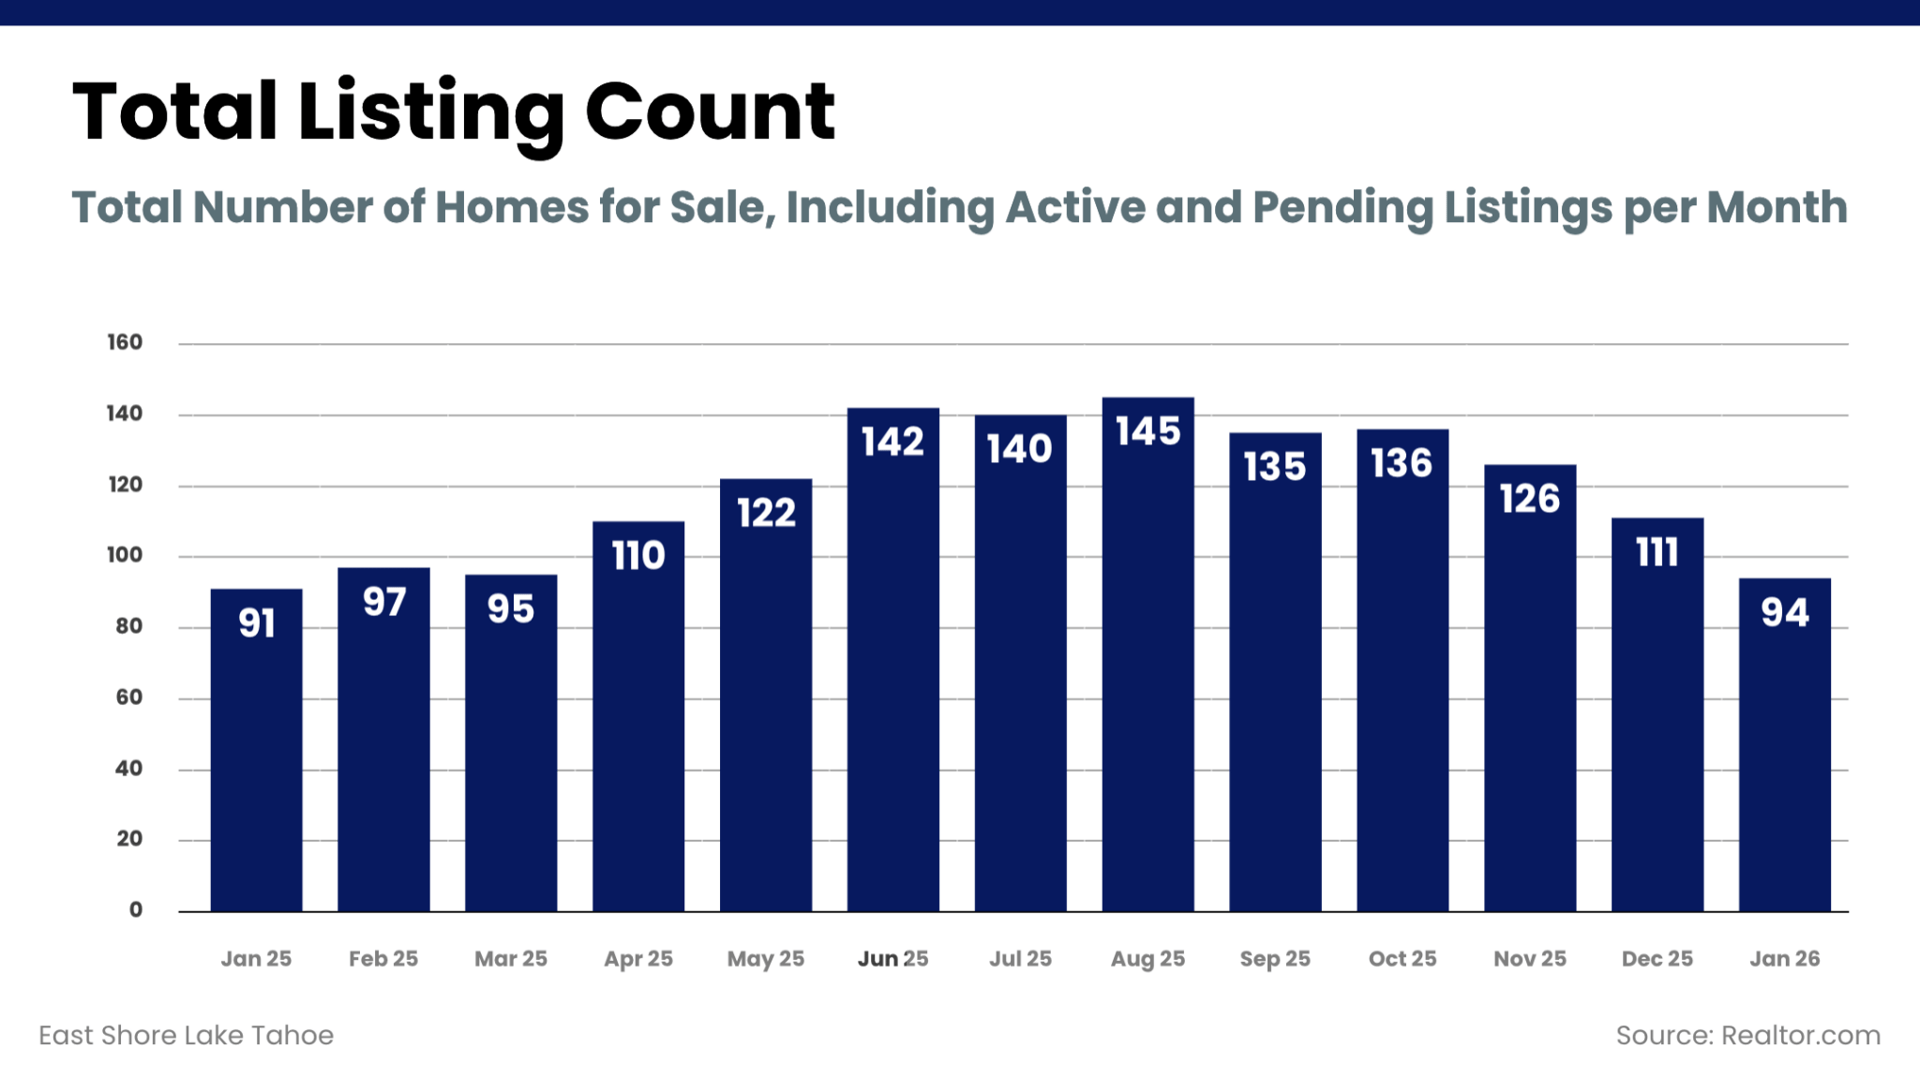
January: 94 homes (↓ from 111 in Dec ’25, ↑ from 91 in Jan ’25)
The total pool contracted notably from December but remains slightly above last January. Month-over-month tightening reflects fewer new listings combined with steady contract activity. Year over year, the modest increase indicates a similar overall market size compared to early 2025. Buyers still have selection, though less than late fall levels, while sellers benefit from a cleaner competitive set.
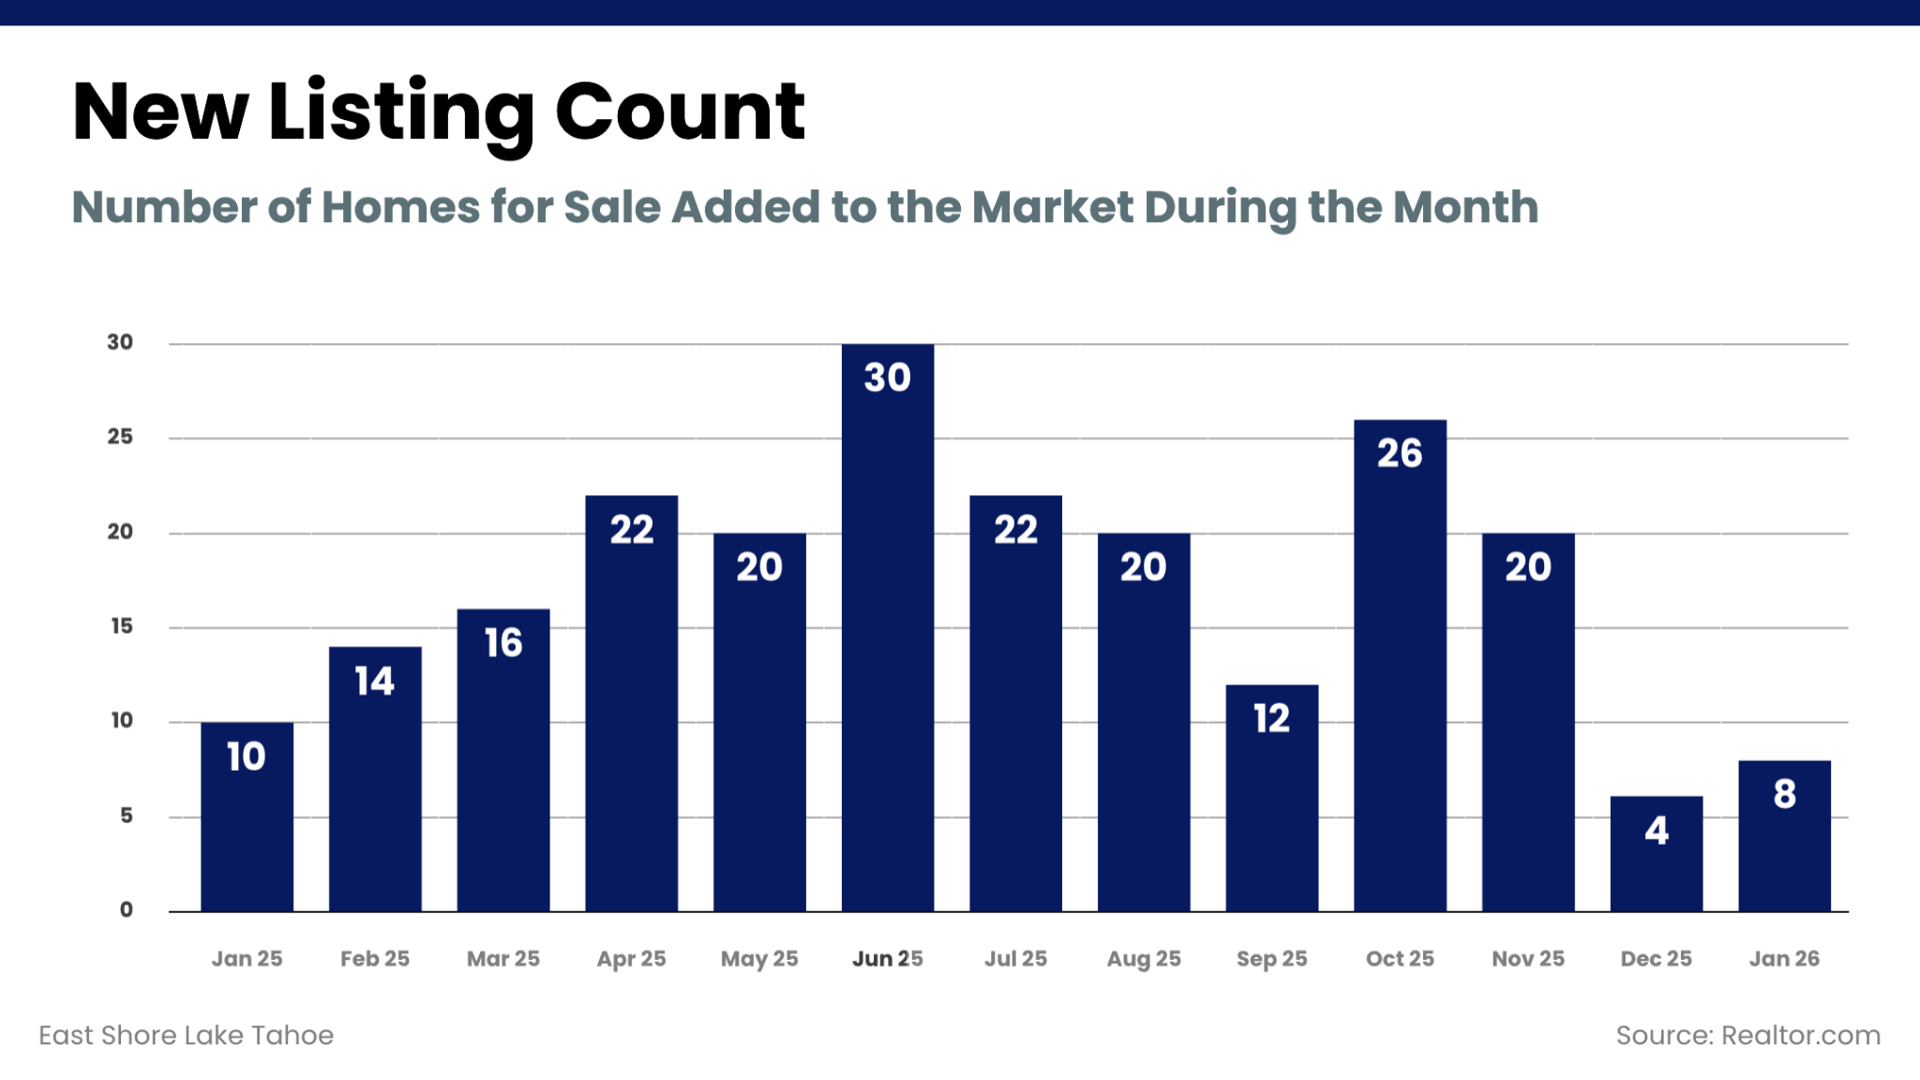
January: 8 homes (↑ from 4 in Dec ’25, ↓ from 10 in Jan ’25)
New inventory ticked up from December’s very low intake but came in below last January. While early winter typically limits listing activity, January did not produce a significant surge in supply. The restrained intake contributed directly to the decline in active inventory. With fewer homes entering the market, pricing accuracy becomes even more visible within the existing pool.
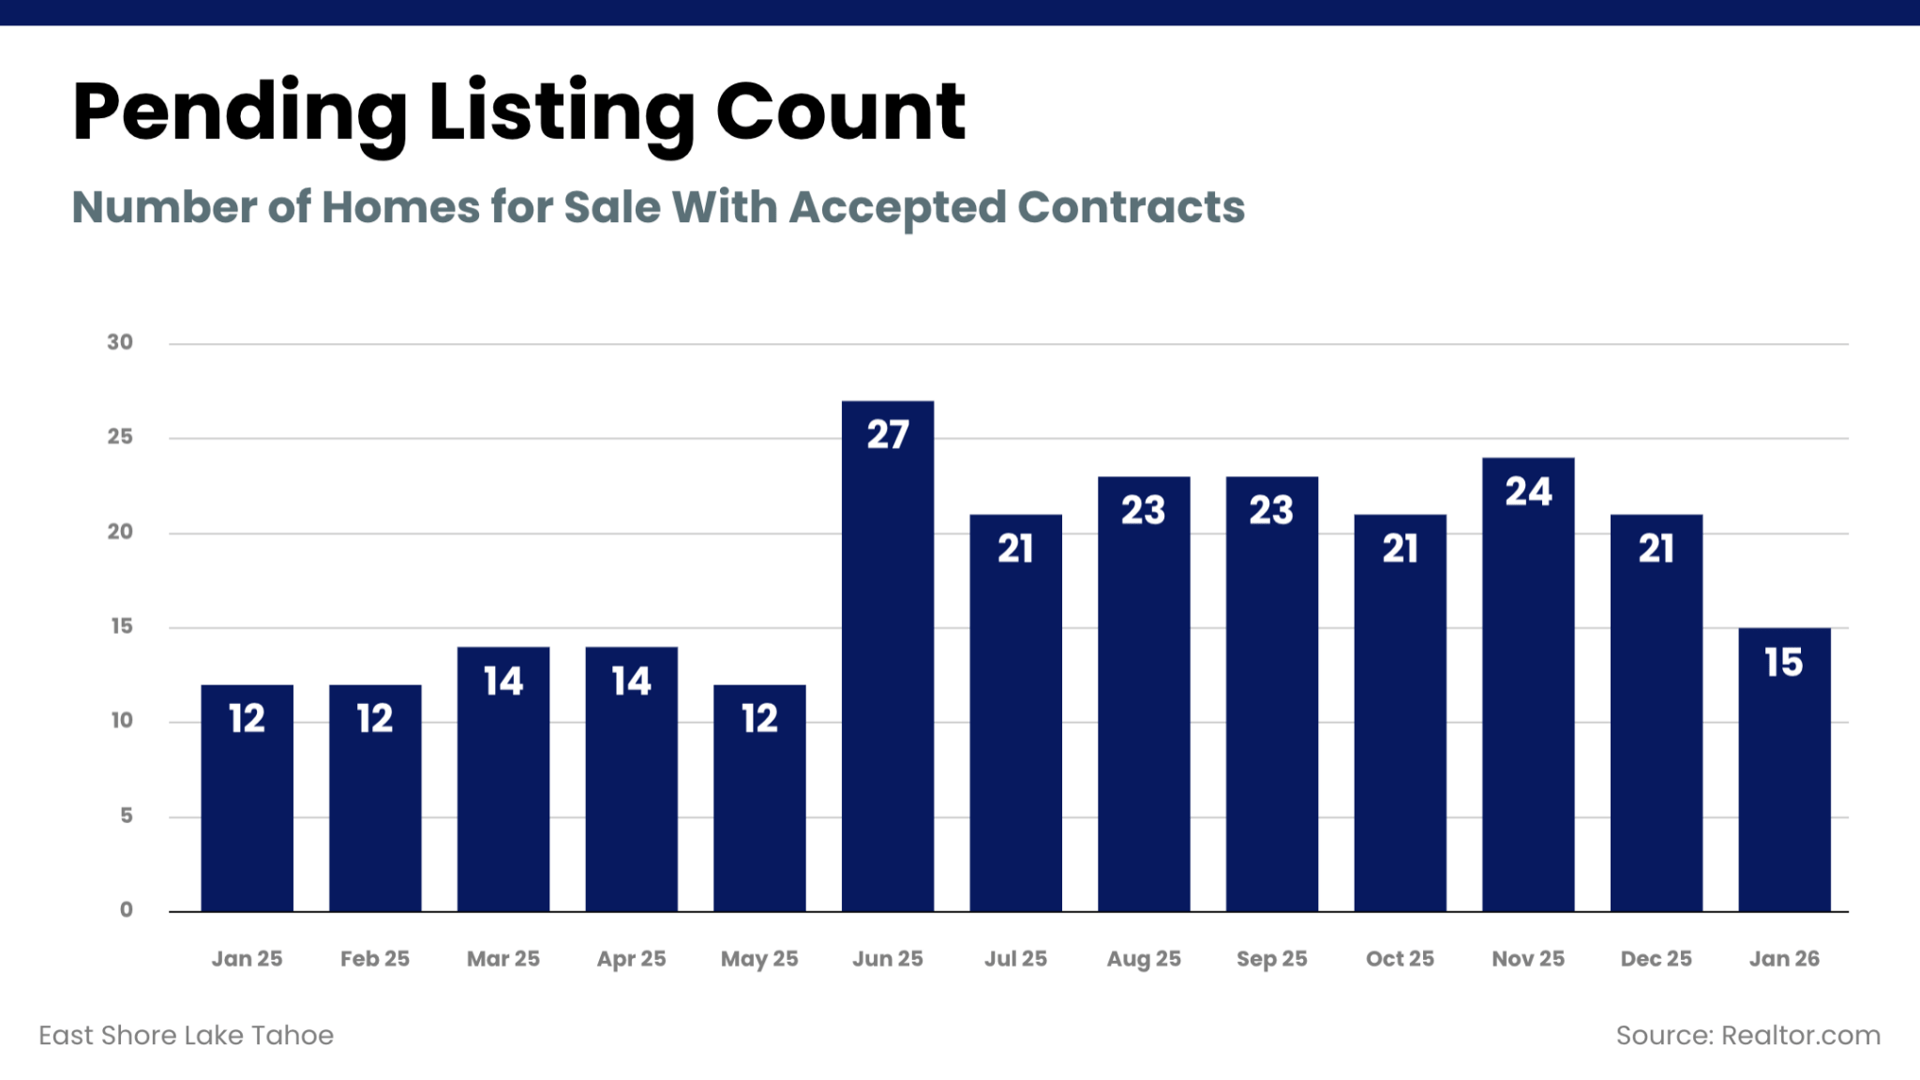
January: 15 homes (↓ from 21 in Dec ’25, ↑ from 12 in Jan ’25)
Accepted contracts slowed from December but exceeded last January’s pace. The month-over-month dip aligns with reduced holiday-driven urgency, while the year-over-year increase signals steady buyer engagement relative to early 2025. Demand remains present, though selective. Buyers continue to transact when properties align with current value expectations.
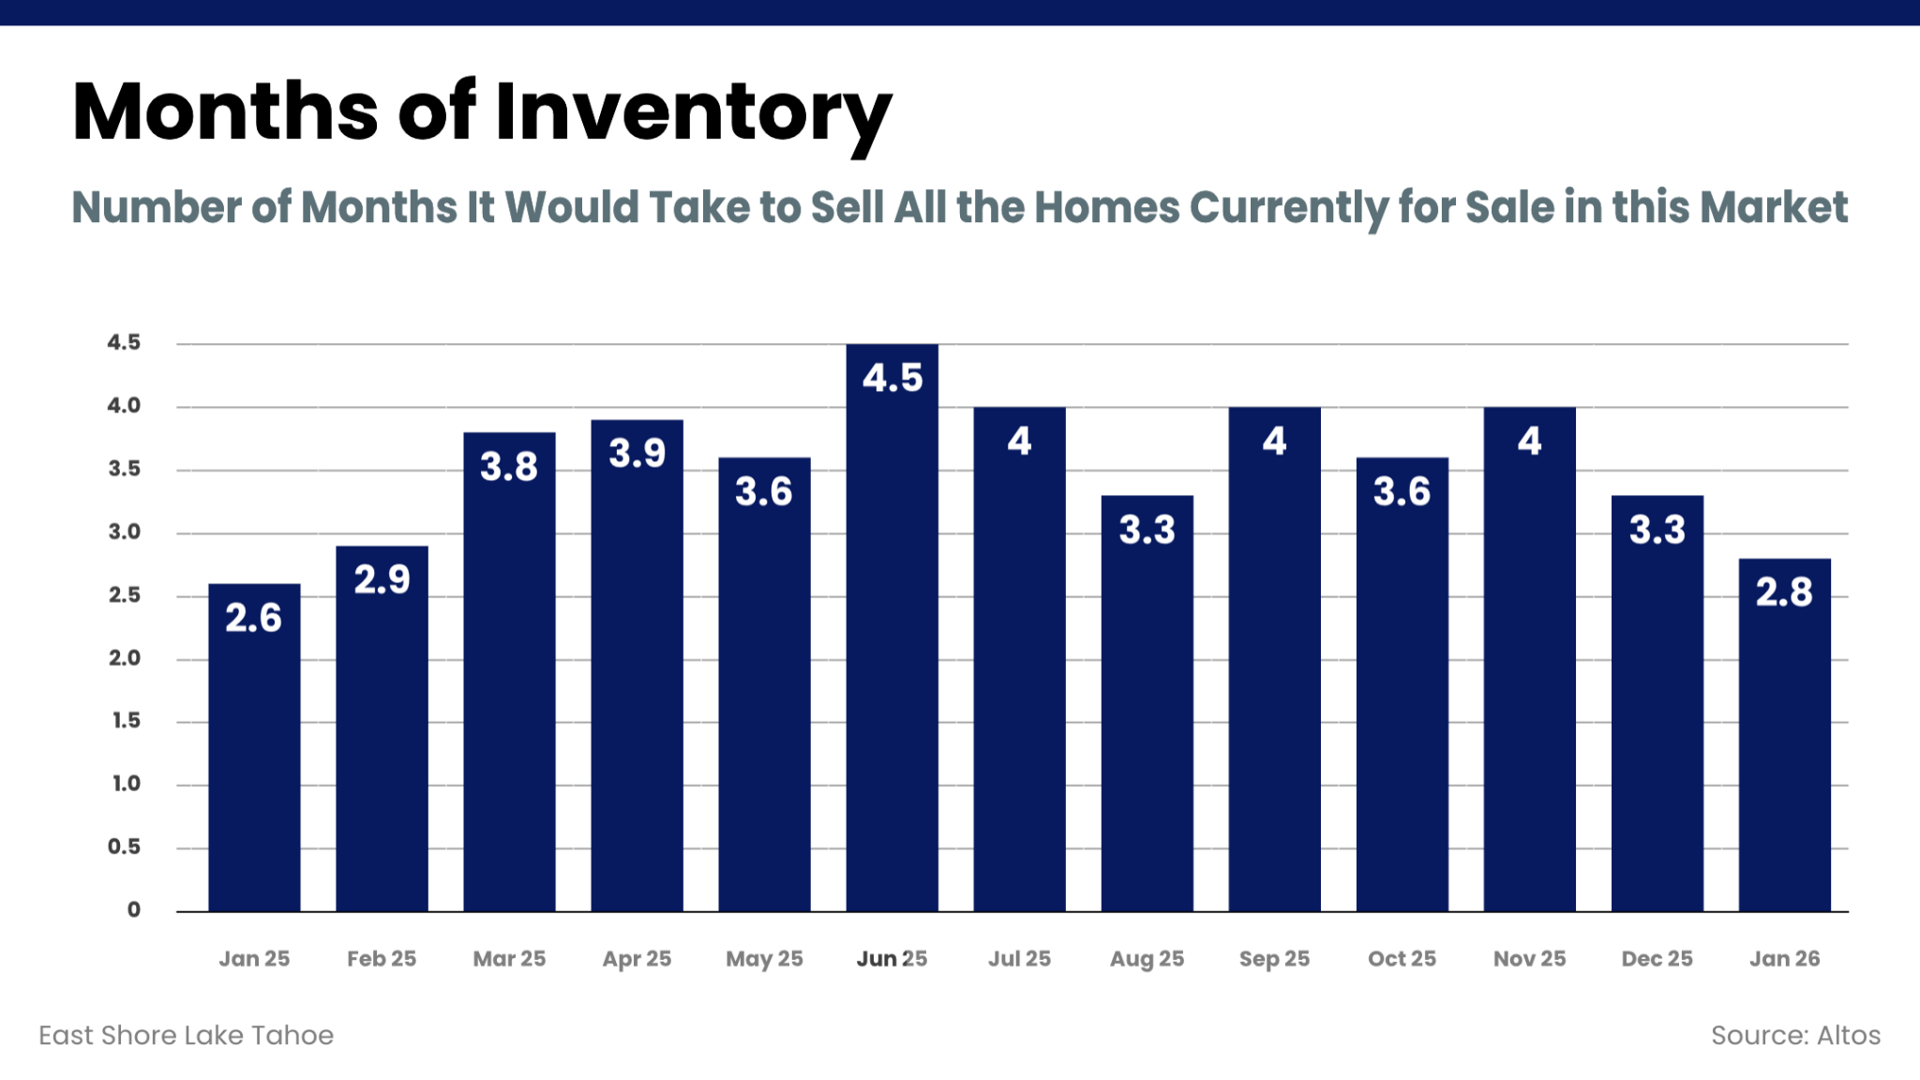
January: 4.0 months (↑ from 3.6 in Oct ’25, ↑ from 3.2 in Nov ’24)
MOI increased month over month and sits higher than last January, reflecting a market with more breathing room for buyers than a year ago. The modest rise aligns with softer seasonal supply combined with steady demand. Overall, MOI reflects a typical late-year balance, with neither buyers nor sellers holding dominant leverage.
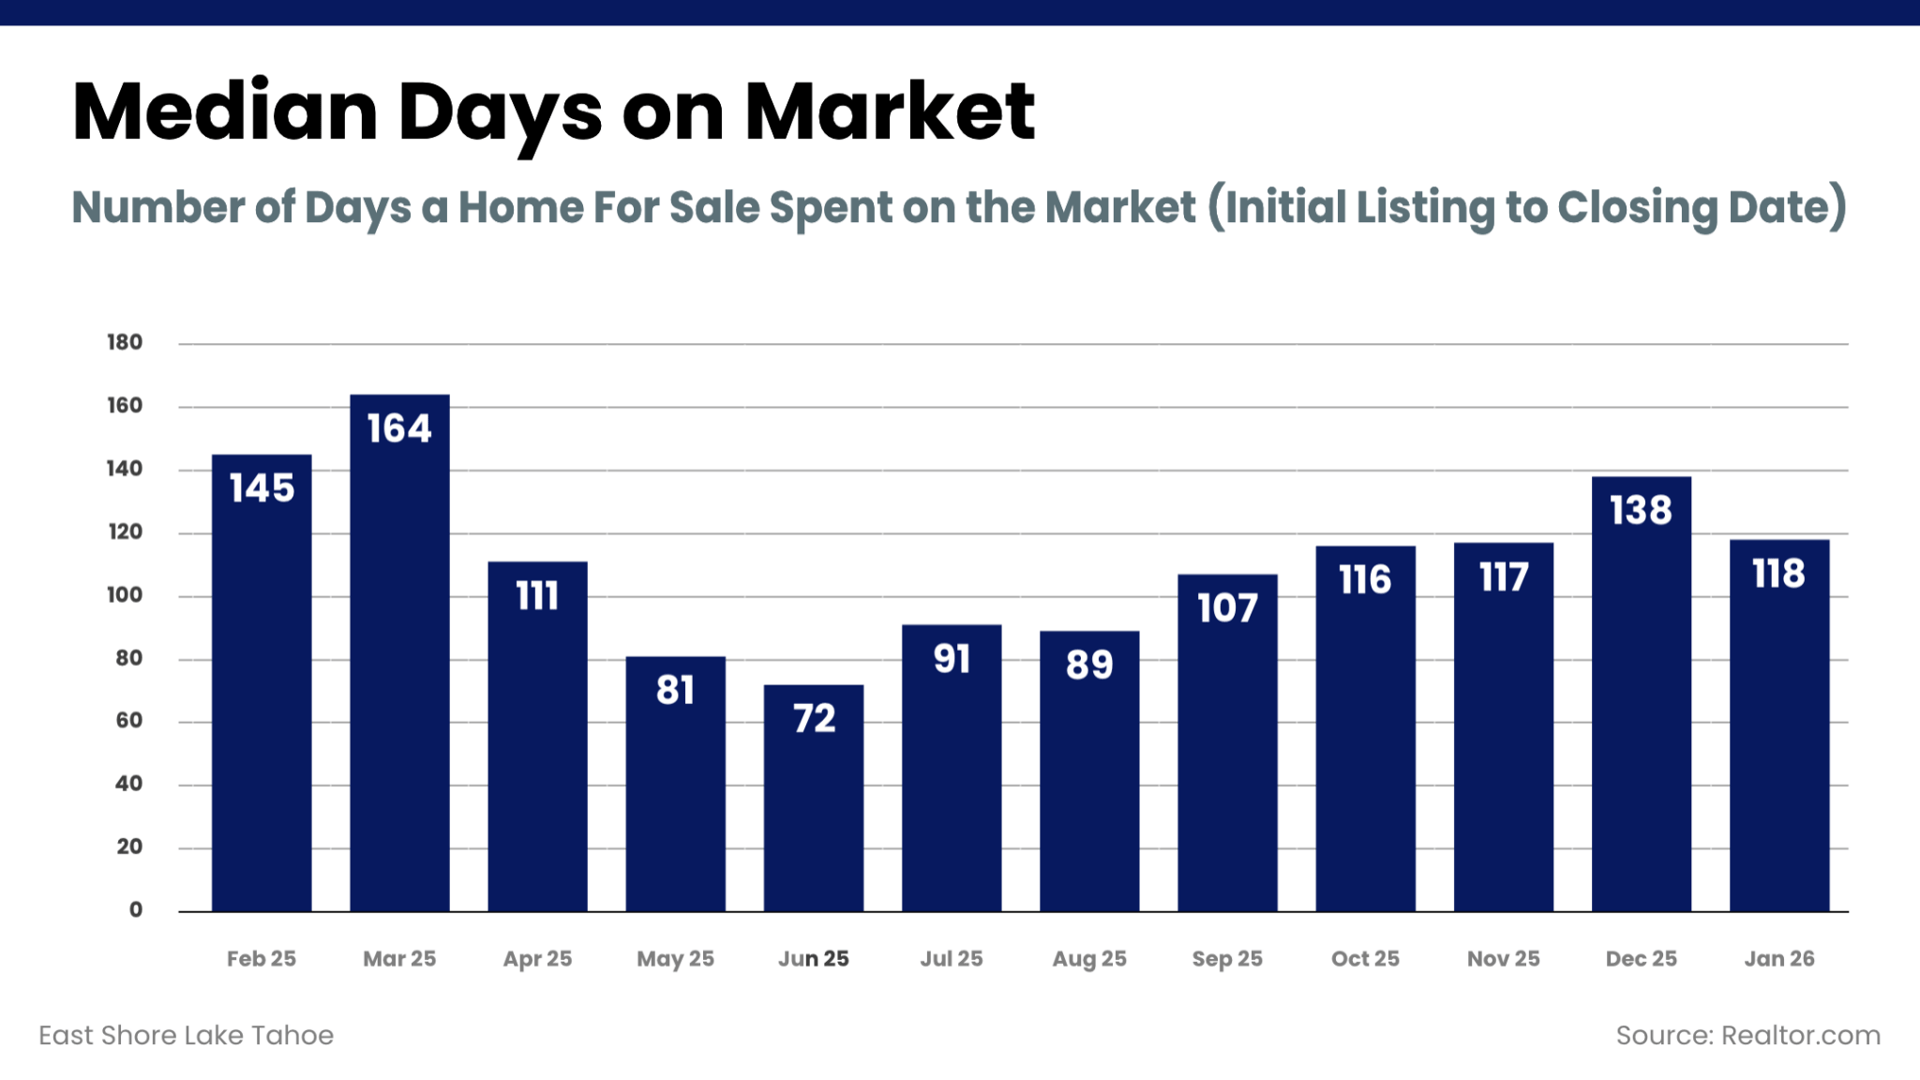
January: 117 days (↑ from 116 in Oct ’25, ↑ from 83 in Nov ’24)
Time on market held nearly flat month over month but is measurably higher than last year. Buyers are taking longer to make decisions, a pattern that reflects both this year’s broader selection and the caution we’re seeing in the current economic climate. Sellers should anticipate longer marketing windows than they experienced in 2024.
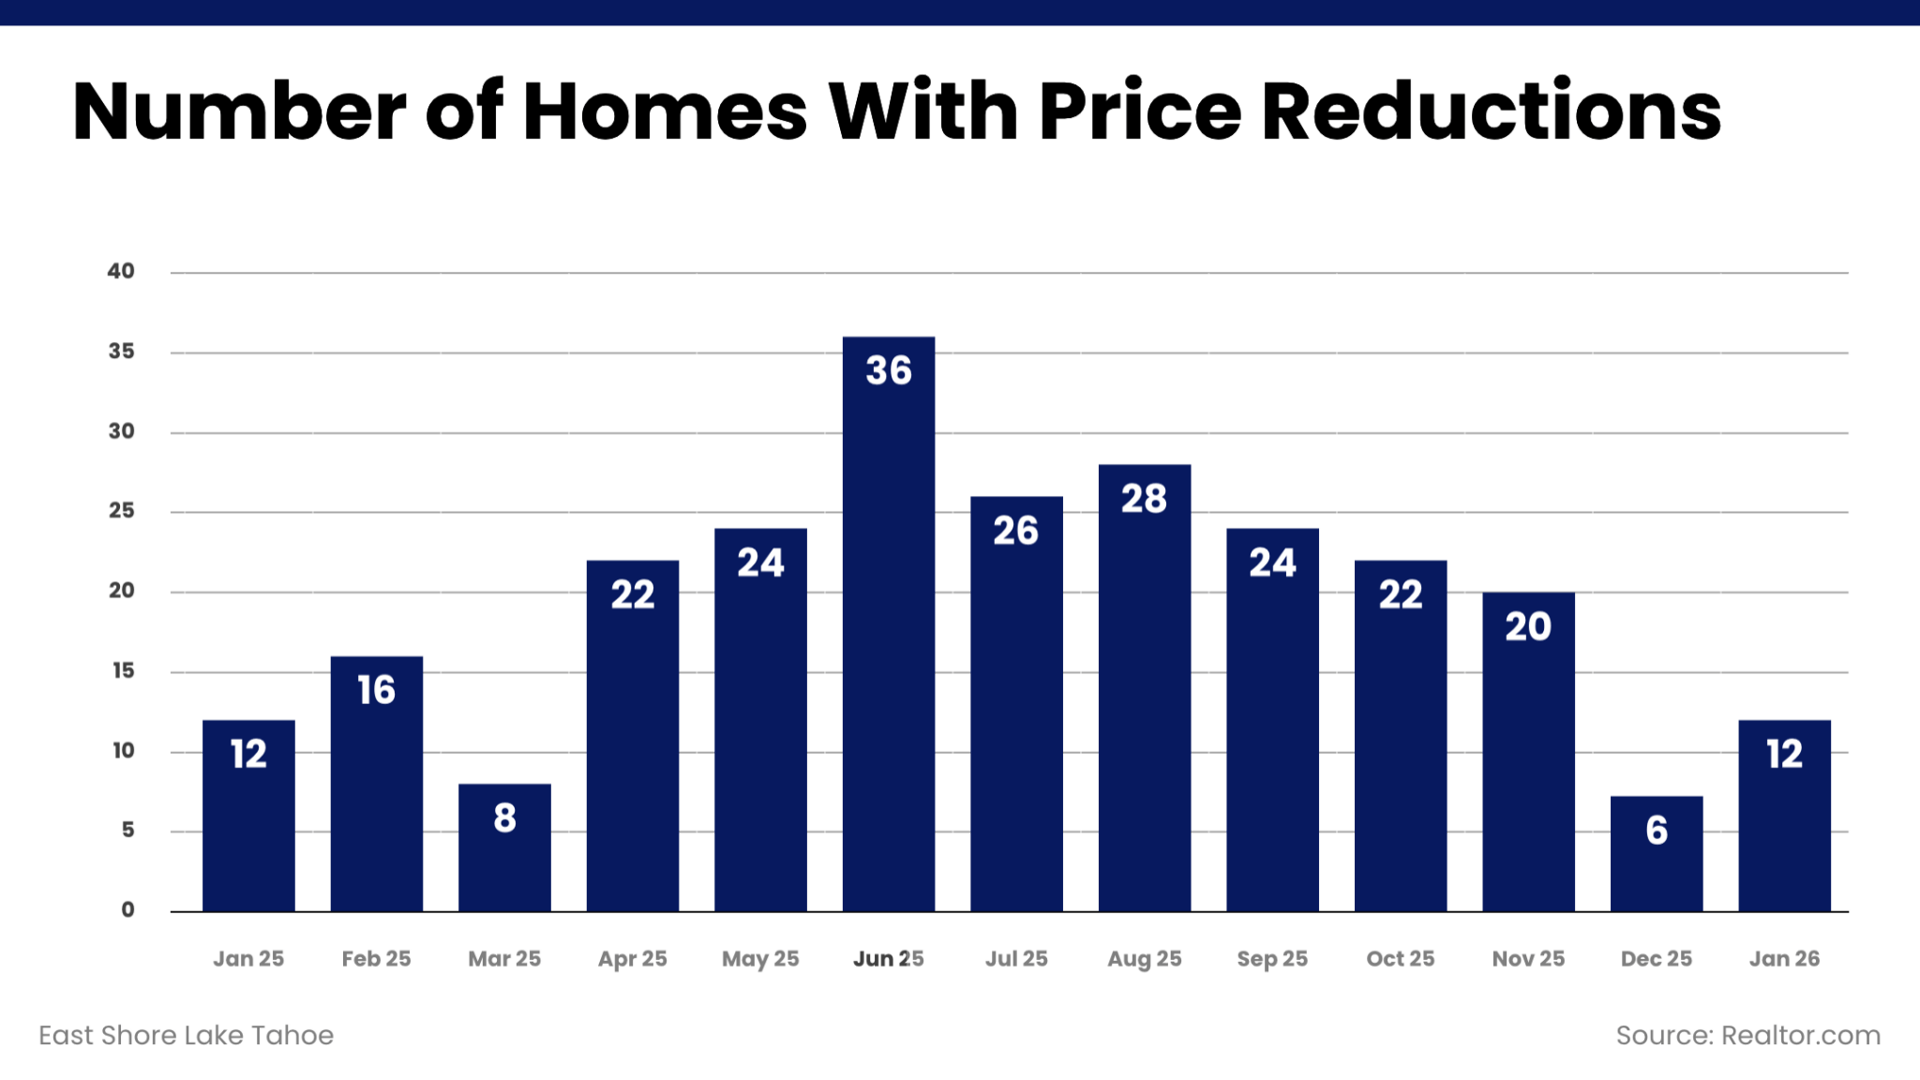
January: 12 homes (↑ from 6 in Dec ’25, = to 12 in Jan ’25)
Price reductions increased from December’s low level and matched last January exactly. The month-over-month rise reflects selective repositioning following the holiday period. Year over year, the identical count suggests no broad escalation in pricing pressure. Adjustments remain strategic rather than widespread.
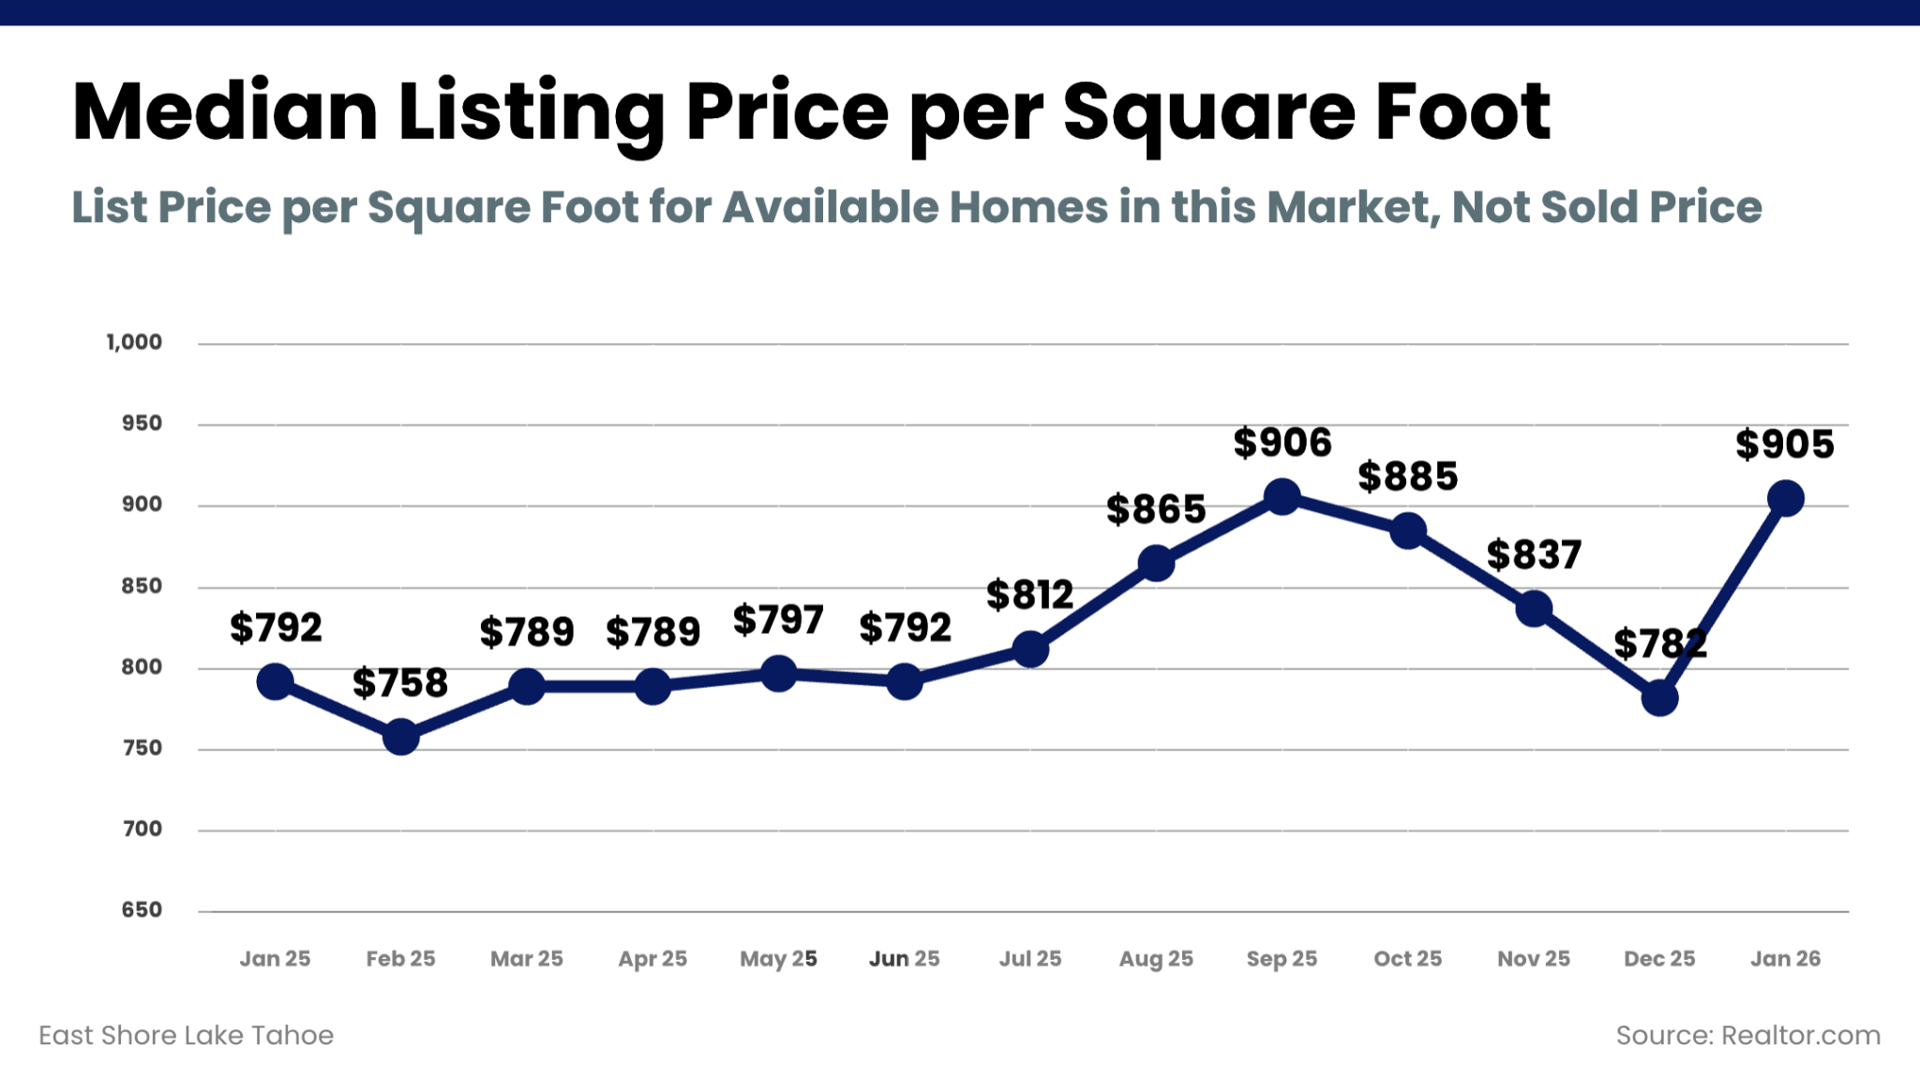
January: $905 (↑ from $782 in Dec ’25, ↑ from $792 in Jan ’25)
Price per square foot rebounded sharply from December and stands well above last January’s level. The jump reflects a shift in the composition of available inventory rather than a broad-based repricing. Higher-end or more recently updated homes can influence this metric disproportionately in smaller winter sample sizes. Buyers should continue evaluating value through property-specific comparisons.
January: $837 (↓ from $885 in Oct ’25, ↓ from $919 in Nov ’24)
Price per square foot declined from both last month and last year, returning closer to mid-year levels. This pattern likely reflects a change in the mix of available inventory—more about the types of homes listed than a broad change in pricing. Buyers evaluating renovated or view-driven properties should continue leaning on micro-comps, as premiums vary widely by condition and location.
Looking ahead, the major housing forecasters are generally calling for a slow, steady 2026 rather than a breakout year. Fannie Mae projects mortgage rates ending 2026 around 5.9% and total home sales around 5.16 million, suggesting gradual improvement in activity as borrowing costs ease. Realtor.com expects mortgage rates to average roughly 6.3%, with home prices up about 2.2%, existing-home sales up about 1.7%, and for-sale inventory continuing to recover by nearly 9% year over year. Zillow similarly forecasts modest price growth in 2026 (about 1.9%) as inventory rebuilds and rates ease only gradually.
These are national forecasts, but the takeaway translates cleanly to the East Shore: if rates drift lower and inventory rebuilds gradually, buyers are likely to remain selective and comparison-driven, and sellers will continue to be rewarded for pricing and presentation that match the most relevant comps in this market. The year opens with fewer homes available, measured contract activity, and pricing that reflects which properties are currently in the market. Compared with early 2025, supply is slightly tighter, and listing values are higher. In this environment, precision — in pricing, preparation, and positioning — continues to determine results.
These are national forecasts, but the implication for the East Shore is straightforward: modest rate relief may support transaction volume, while gradual inventory growth increases buyer choice. When options expand without a sharp drop in borrowing costs, purchasing decisions become more data-driven. In this environment, properties that are aligned with current comparable sales outperform those that rely on timing alone.


4th of July in Lake Tahoe


Activities, Events, Live Music
Get In Touch